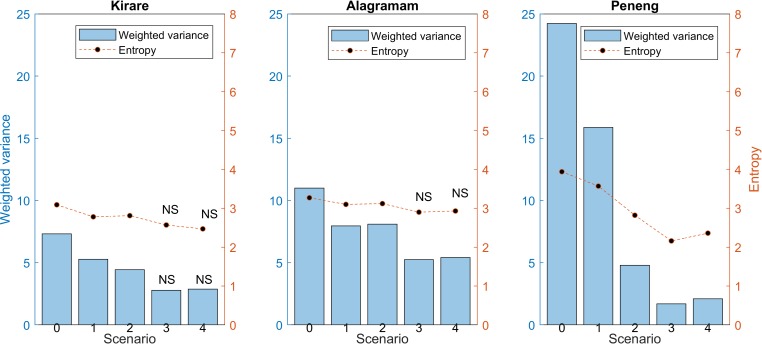
Fig 6. Weighted variance and entropy values of EPIFIL predictions of LF elimination timelines using optimal MDA coverage in each study site.
For all sites, either scenario 3 or 4 had the lowest entropies, and scenario 4 was not significantly different from scenario 3 for Kirare and Alagramam. These results were not statistically different from the results given 65% coverage (see Table 2), suggesting that the data stream associated with the lowest entropy is robust to changes in the interventions simulated. Scenarios where the weighted variance or entropy were not significantly different from the lowest entropy scenario are noted with the abbreviation NS. Significance was determined using the Benjamini-Hochberg procedure for controlling the false discovery rate (q = 0.05).

