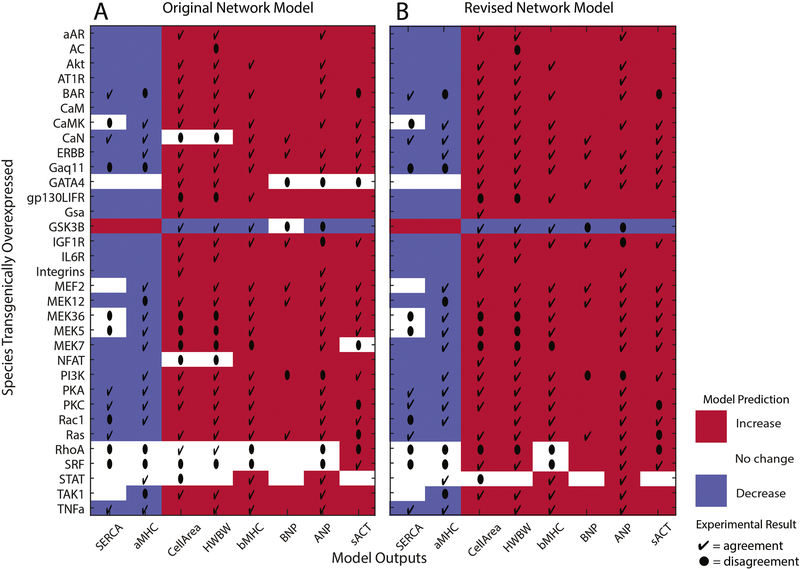
Figure 2. Cardiac hypertrophy model accurately predicts majority of in vivo overexpression output species data.
Model predictions for the output species (x-axis) with individual species overexpression (y-axis) are color coded for A) the original and B) the revised cardiac hypertrophy signaling network. Red indicates increase, white indicates no change, and blue indicates decrease. In vivo experimental data in agreement with the model predictions are indicated by a check (4) and data that disagree are indicated by a dot (l). There is 72% agreement with the original model, which increases to 78% after model revision.

