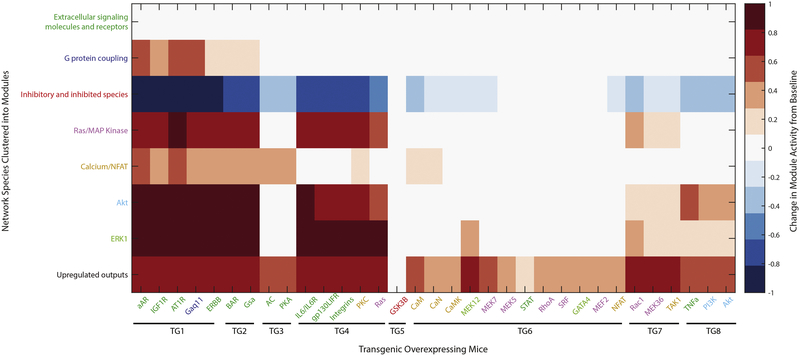
Figure 4. Network activation by modular relationships of species and mice.
The K-means clustering algorithm in MATLAB allowed condensations of the 107 network model species into 8 functional modules (y-axis) and clustering of the 34 species for which transgenic overexpressing mice exist into 8 groups (x-axis) with the most similar network responses. The predicted average response of each module is shown for overexpression of an individual species.

