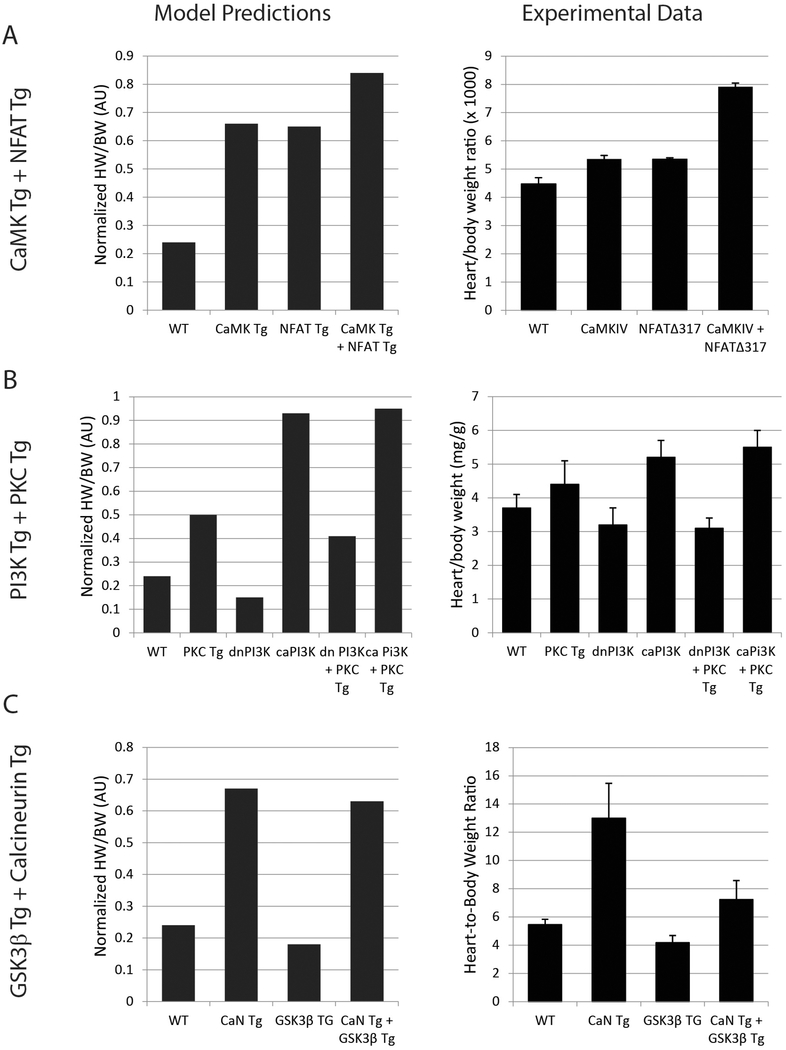
Figure 5. Cardiac hypertrophy model accurately predicts in vivo hypertrophy responses in single and double transgenic mice.
The in vivo hypertrophy response is indicated by the heart to body weight ratio. In each panel, network model predictions are shown on the left and experimental data from the literature are replotted on the right. A) Individual and double transgenic overexpression of calcium/calmodulin-dependent protein kinase VI (CaMK) and constitutively activated NFAT3, with experimental data from [15]. B) Individual and double transgenic expression of constitutively activated or dominant negative phosphoinosotide 3-kinase (PI3K) and protein kinase C β2, with experimental data from [28]. C) Individual and double transgenic overexpression of activated calcineurin (CaN) and activated glycogen synthase-3β, with experimental data from [29].

