
Figure 3.
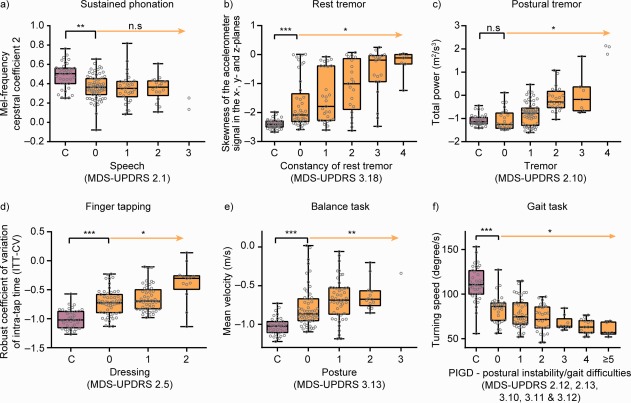
Active test feature scores aggregated over 2 weeks of in‐home testing demonstrated case‐control differences, significant relationships with clinical severity ratings, and significantly greater sensitivity compared with MDS‐UPDRS item/subscale scores from site visits. The orange arrow indicates the statistical test for association of increased disease severity as to the selected MDS‐UPDRS item with the digital biomarker feature, taking into account repeated measures per participant. The black square bracket indicates a comparison of the control group (C) with PD participants that are rated “0” for the corresponding MDS‐UPDRS item. * P < 0.05; ** P < 0.01; *** P < 0.001. C, control group; MFCC2, mel‐frequency cepstral coefficient 2; n.s, not significant.