
Figure 2.
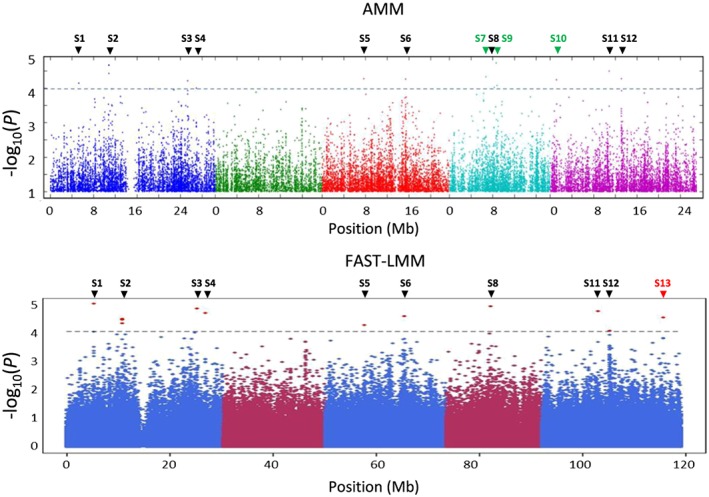
Genome‐wide association mapping results of salicylic acid‐mediated effect on methyl JA‐induced PLANT DEFENSIN1.2 expression. Manhattan plot of the –log10(p) single nucleotide polymorphism marker‐trait associations performed by accelerated mixed model (AMM) and FAST‐LMM. From left to right, different colors represent Arabidopsis chromosomes I‐V. The dotted grey line indicates the arbitrary threshold of –log10(p) = 4. Arrows indicate loci with significant single nucleotide polymorphism‐trait associations in the AMM (green), FAST‐LMM (red), or both AMM and FAST‐LMM analysis (black)