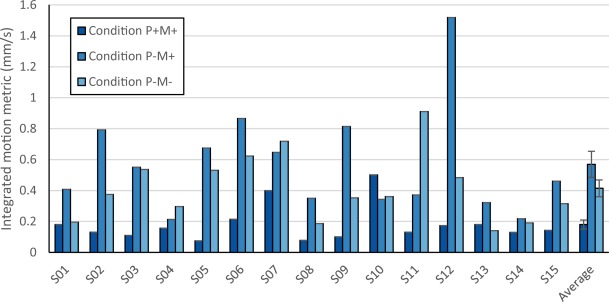
Figure 3.

Plots of integrated motion metric of residual motion picked up by SPM postprocessing for all participants. Most participants exhibit the common trend of least residual motion in Condition P + M+, followed by Condition P−M−, and most residual motion in Condition P−M+. Error bars in the average integrated motion metric indicate standard error over participants [Color figure can be viewed at http://wileyonlinelibrary.com]
