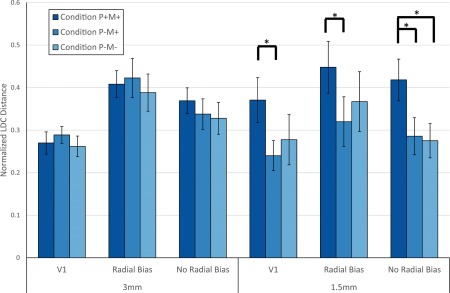
Figure 5.

Plot of normalized LDC distance per condition, resolution and ROI. The distance measures were averaged across all 15 participants. Error bars indicate standard error over participants. * indicates p < .05 (corrected for multiple comparisons, Tukey's HSD test) [Color figure can be viewed at http://wileyonlinelibrary.com]
