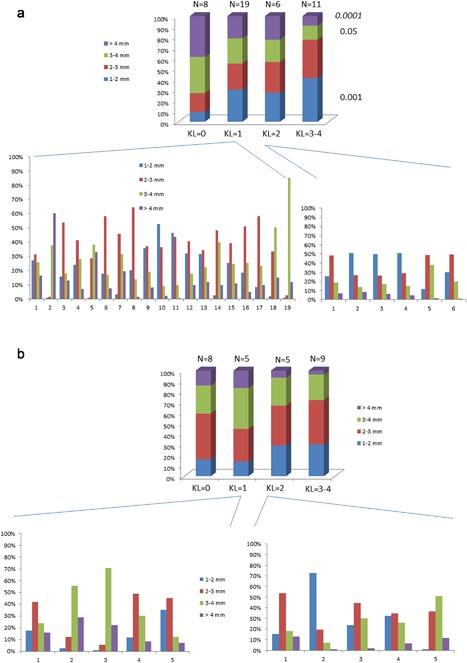
Figure 6.

The mean JSW distributions (JSW1–2 mm, JSW2–3 mm, JSW3–4 mm, JSW>4 mm) from 3D maps according to the KL classification (a) for the female subgroup (n = 44) and (b) for the male subgroup (n = 27). For both groups, individual JSW distribution classified as KL = 1 and KL = 2.
