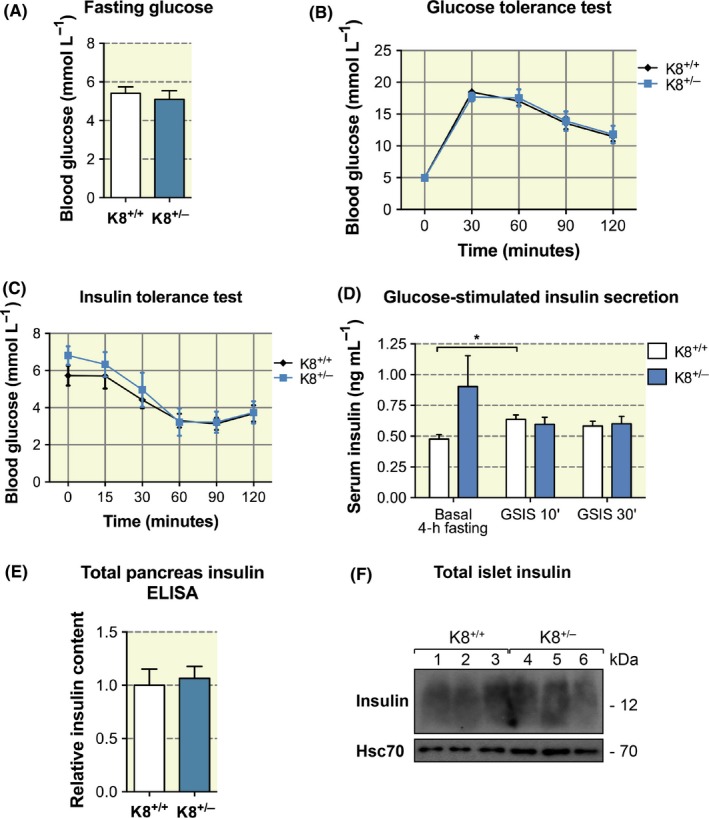
Figure 2.

K8+/− mice exhibit no significant changes in blood glucose and insulin regulation compared to K8+/+ mice. A, Blood glucose levels after overnight fasting in 3‐ to 4‐mo‐old K8+/+ mice and K8+/− mice showed no significant differences using t test. Bars represent mean ± SEM, n = 10 for K8+/+ and n = 8 for K8+/− mice. B, K8+/+ and K8+/− mice were subjected to a glucose tolerance test. Mice were fasted overnight and then challenged with 2 g/kg d‐glucose administered i.p. No changes in blood glucose levels were observed between K8+/+ and K8+/− mice as evaluated using repeated measures two‐way ANOVA. Bars represent mean ± SEM, n = 10 for K8+/+ and n = 8 for K8+/− mice. C, K8+/+ and K8+/− mice showed no significant changes in blood glucose levels, using repeated measures two‐way ANOVA, when subjected to an insulin tolerance test by 0.75 U/kg i.p. insulin after 4‐h fasting. Bars represent mean ± SEM, n = 7 for K8+/+ and n = 9 for K8+/− mice. D, Glucose‐stimulated insulin secretion (GSIS) was measured 10 and 30 min (') after i.p. glucose 2 g/kg of body weight in K8+/+ mice and K8+/− mice. A significant increase in fasting versus 10 min GSIS can be seen for K8+/+ mice, analysed by one‐way ANOVA and Bonferroni's correction, but no overall differences in GSIS responses between the genotypes were observed when compared using two‐way ANOVA. Plot shows mean ± SEM, n = 8‐10 mice/group for fasting insulin and 4‐5 mice/group for glucose‐stimulated insulin secretion. E, Relative pancreatic insulin content as determined by enzyme‐linked immunosorbent assay showed no differences between K8+/+ mice and K8−/− mice. Bars indicate mean ± SEM, n = 5 for K8+/+ mice and n = 7 for K8+/− mice. F, Immunoblotting of K8+/+ (n = 3, lanes 1‐3) and K8+/− (n = 3, lanes 4‐6) isolated pancreatic islets showed no changes in the protein amount of insulin between the genotypes
