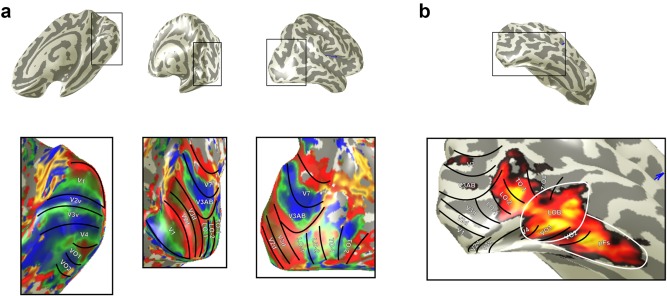
Figure 1.

(a) Retinotopically defined ROIs. Upper row shows the inflated right hemisphere for one participant. Bottom row shows the same inflated hemisphere with overlaid color map detailing polar angle data from rotating wedge stimuli. Visual areas are subsequently drawn and labeled according to the reversals in phase that demarcate them. (b) Heat map from the localizer experiment. LOB and pFs are drawn in white
