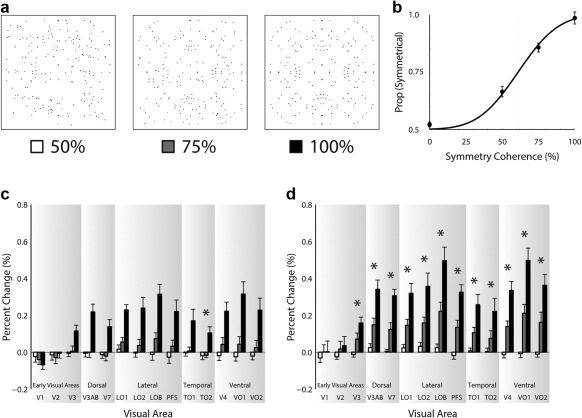
Figure 3.

Panel (a) shows exemplar 4‐fold stimuli for 50%, 75%, and 100% coherence and panel (b) shows group psychophysical performance to these stimuli. Panels (c) and (d) show the fMRI results for the passive viewing and symmetry detection experiments, respectively. Visual areas are labeled on the abscissa and percent signal change is shown on the ordinate. Responses to the 50% coherence stimuli are represented by white bars, 75% coherence stimuli by grey bars, and 100% coherence stimuli by black bars. Error bars show ± SEM. Asterisks indicate significant linear trend
