Figure 1.

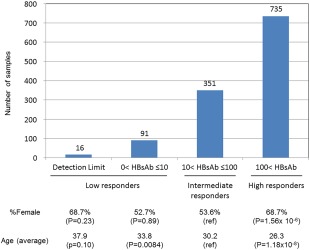
Distribution of HBsAb levels among 1,193 Japanese individuals. P values were calculated using a chi‐quared test and Welch's t‐test for percentage of female and average age, respectively.

Distribution of HBsAb levels among 1,193 Japanese individuals. P values were calculated using a chi‐quared test and Welch's t‐test for percentage of female and average age, respectively.