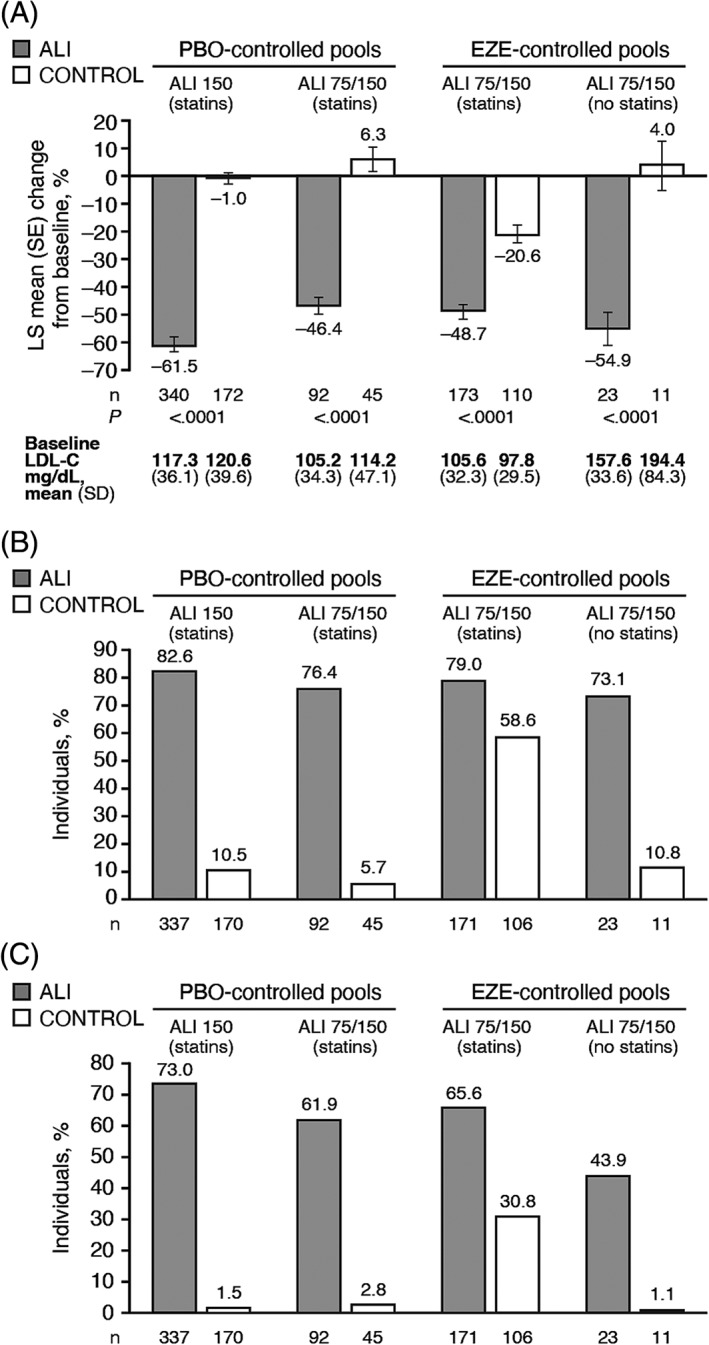
Figure 1.

A, Percentage change from baseline to week 24 in LDL‐C and proportion achieving B, LDL‐C < 70 mg/dL or C, <55 mg/dL at week 24 among individuals with both DM and ASCVD, by analysis pool. Baseline values are from the randomized population. LS means (SE) in panel A derived from a mixed‐effect model with repeated measures (ITT analysis). Proportions in panel B and C estimated from multiple imputation (modified ITT analysis). Abbreviations: ALI 150, alirocumab 150 mg Q2W; ALI 75/150, alirocumab 75 mg Q2W with possible increase to 150 mg Q2W at Week 12 based on Week 8 LDL‐C; ASCVD, atherosclerotic cardiovascular disease; DM, diabetes mellitus; EZE; ezetimibe; ITT, intent‐to‐treat; LDL‐C, low‐density lipoprotein cholesterol; LS, least‐squares; ND, not derivable (proportion in control group too small); PBO, placebo; Q2W, every 2 weeks; SE, standard error
