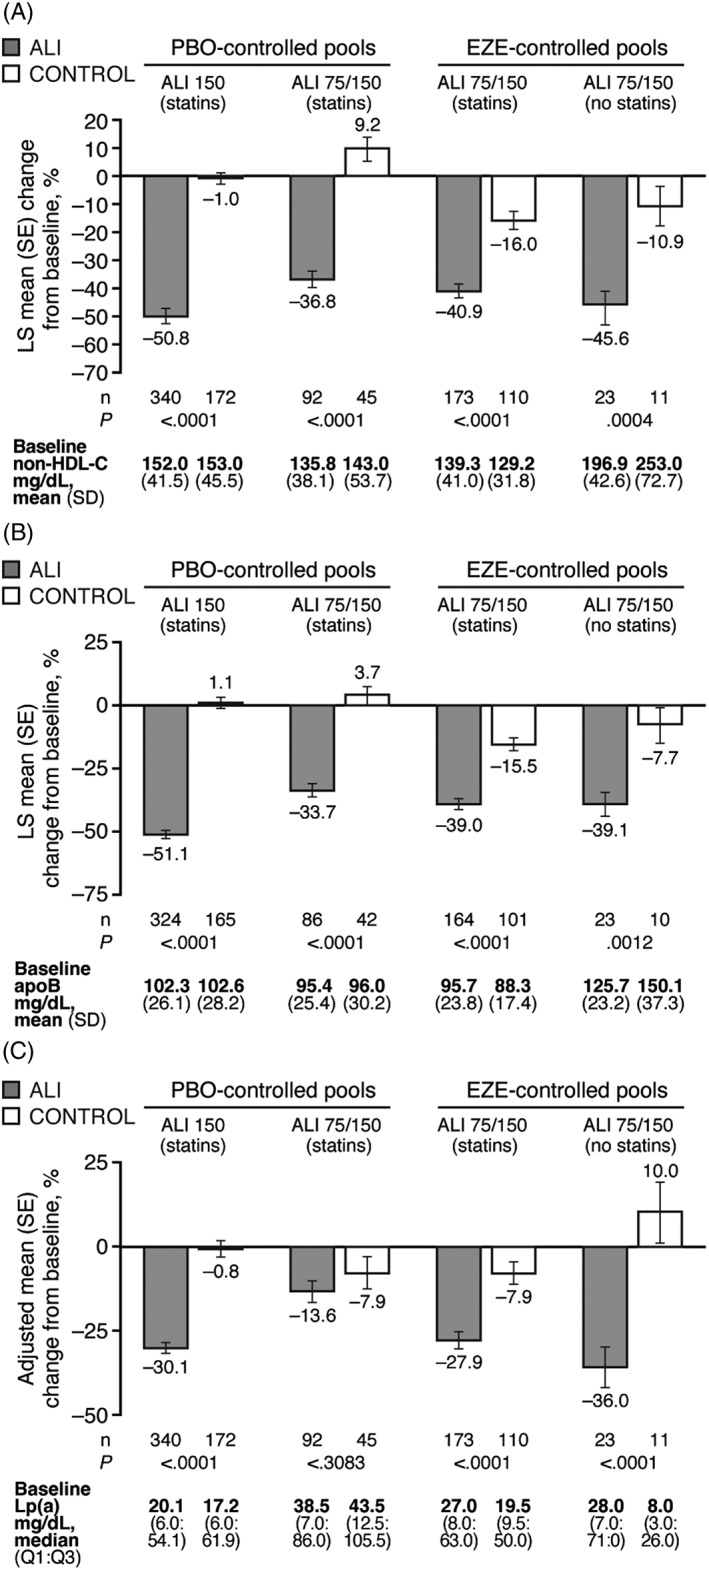
Figure 2.

Percentage change from baseline to week 24 in A, non‐HDL‐C, B, apoB and C, Lp(a) among individuals with both DM and ASCVD, by analysis pool. Baseline values are from the randomized population. LS means (SE) in panels A and B derived from a mixed‐effect model with repeated measures (ITT analysis). Adjusted means (SE) in panel C from multiple imputation followed by robust regression (ITT analysis). Abbreviations: ALI 150, alirocumab 150 mg Q2W; ALI 75/150, alirocumab 75 mg Q2W with possible increase to 150 mg Q2W at Week 12 based on Week 8 LDL‐C; apo, apolipoprotein; ASCVD, atherosclerotic cardiovascular disease; DM, diabetes mellitus; EZE; ezetimibe; HDL‐C, high‐density lipoprotein cholesterol; ITT, intent‐to‐treat; Lp(a), lipoprotein (a); LS, least‐squares; PBO, placebo; SE, standard error
