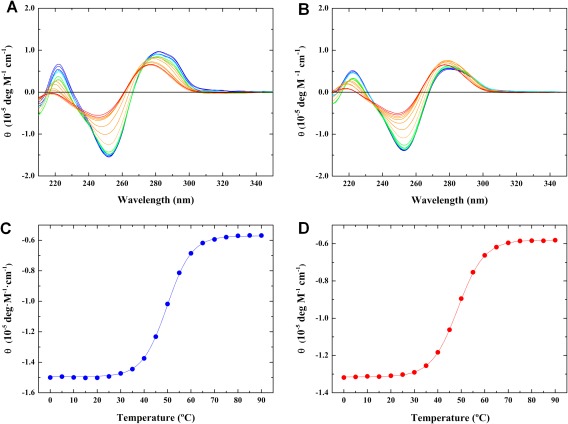
Figure 2.

Representative Temperature‐Dependent CD Profiles for the Single AP‐Site CFC/GGG (Panels A, C) and Bistrand AP‐Site CFC/GFG (Panels B, D) Duplexes. The CD spectra (Panels A and B) are acquired at 5.0°C intervals over the temperature range of 0–90°C. Molar ellipticities at 250 nm are plotted as a function of temperature (Panels C and D) to derive duplex dissociation transition temperatures of 49.0 and 47.1°C for CFC/GGG and CFC/GFG, respectively
