Figure 2.

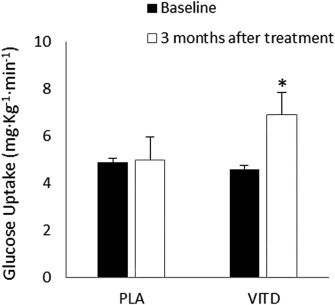
Insulin sensitivity (glucose uptake) at baseline (black bars) and after 3 months of treatment (white bars) in the placebo (PLA) and vitamin D (VITD) groups; *P = 0.02.

Insulin sensitivity (glucose uptake) at baseline (black bars) and after 3 months of treatment (white bars) in the placebo (PLA) and vitamin D (VITD) groups; *P = 0.02.