Figure 3.

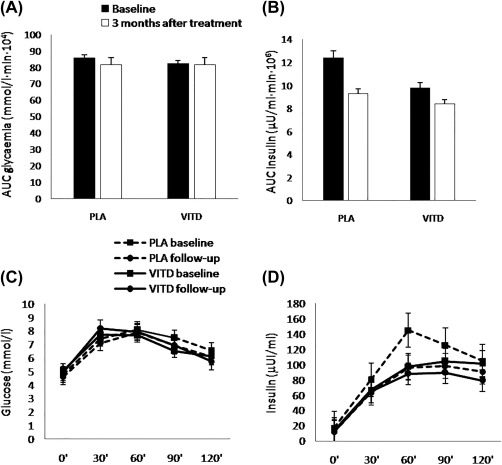
Areas under the curve (AUC) for (A) glycemia and, (B) insulin and (C) glucose and (D) insulin curves during oral glucose tolerance tests at baseline and after 3 months of treatment in both groups.

Areas under the curve (AUC) for (A) glycemia and, (B) insulin and (C) glucose and (D) insulin curves during oral glucose tolerance tests at baseline and after 3 months of treatment in both groups.