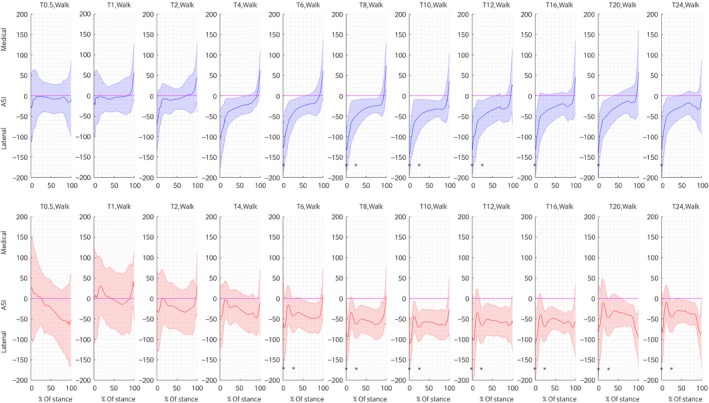
Figure 3.

Average front (upper row, blue) and hind (lower row, red) Medial‐Lateral ASIs calculated for the complete stance duration at walk for the different ages. The line represents the mean ASI of all foals and the shaded area the median absolute deviation of all foals. Statistically significant differences at the different time points of stance (1, 25, 50 and 75% of stance) compared to the first measurement (age 0.5 weeks at walk and 2 weeks at trot) are indicated with an *.
