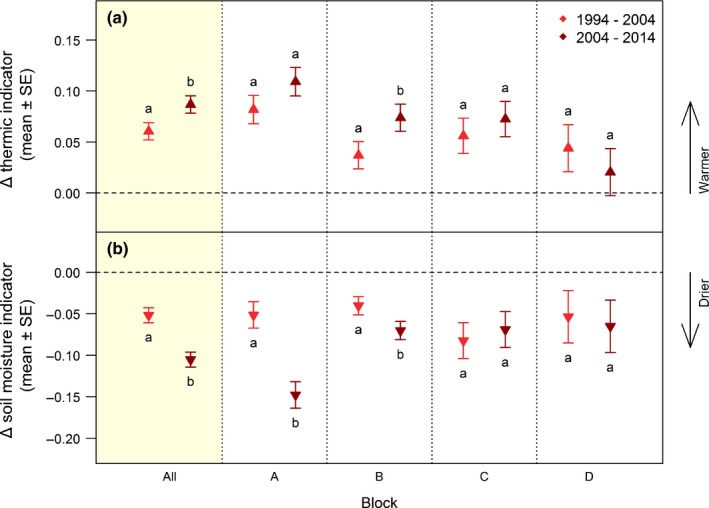
Figure 4.

Changes in community‐weighted ecological indicators. Changes in (a) thermic indicator (Gottfried et al., 2012) and (b) soil moisture indicator in the periods 1994–2004 and 2004–2014 (Supporting Information Tables S16, S19). Modelled effect sizes and ± SE over the entire study area (All, shaded) and for each block (A, B, C, D) are shown (Tables S17, S20). For plot numbers per block, see Table S1. Different lowercase letters denote significant differences between the changes in indicators from the first to the second decade within each block based on linear mixed‐effects models (Tables S18, S21).
