
Figure 5.
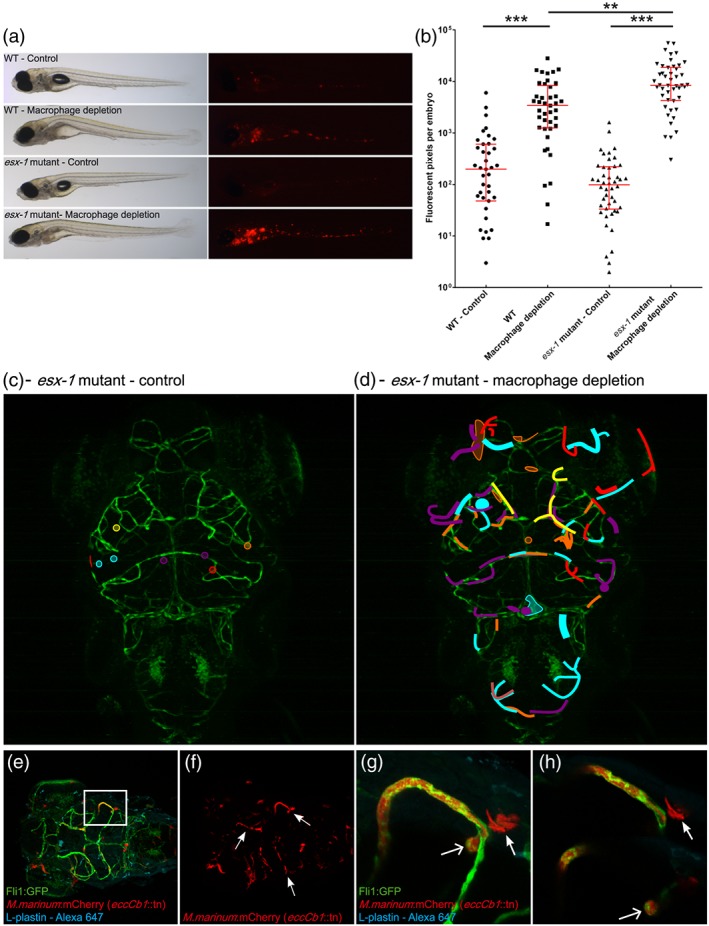
ESX‐1‐deficient mycobacteria are found predominantly in blood vessels. (a) Representative bright field and corresponding fluorescent image of infected larvae at 4 dpf with either M. marinum E11 or M. marinum esx‐1 mutant with or without phagocyte depletion. Images clearly illustrate increased fluorescent intensity in phagocyte‐depleted groups. (b) Corresponding fluorescent pixel counts of infected larvae of three pooled biological independent infection experiments. Graphs show mean and SEM. ** = <.05, *** = <.005. (c) Schematic representation of esx‐1 mutant infection pattern in head of control larvae, pooled data from five larvae. (d) Schematic representation of esx‐1 mutant infection distribution found in five phagocyte‐depleted larva, showing that high amounts of mycobacteria are found predominantly in blood vessels. (e) Z‐stack, dorsal view of Tg(Fli1:GFP) y1 larvae (green), depleted of its phagocytic pool and systemically infected with the esx‐1 mutant (red) at 4 dpf, stained with L‐plastin (cyan) to visualise remaining phagocytes, showing high infection load in brain area. (f) Shows single red fluorescent signal, demonstrating that bacteria are strictly localised in the vasculature (arrows). Boxed area is enlarged in (g) z‐stack, and (h) two single Z‐slices, evidently showing an abundant amount of bacteria clogging the blood vessel, with subsequent bacterial overgrowth, protrusion (open arrow) and (very rare) bursting of the blood vessel wall (closed arrow)