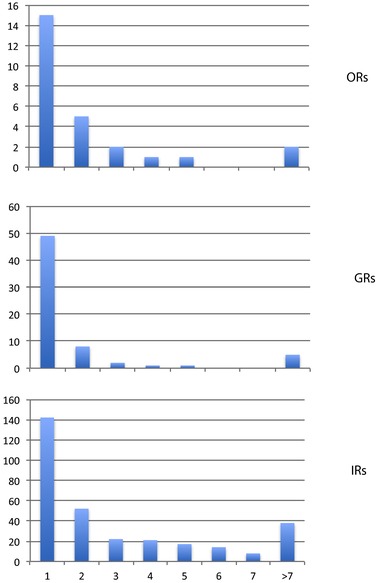
Figure 5.

Histograms of numbers of pseudogenizing mutations in the three chemoreceptor families. The x‐axis is the number of pseudogenizing mutations and y‐axes are the number of pseudogenes in each category [Color figure can be viewed at http://wileyonlinelibrary.com]
