Figure 1.

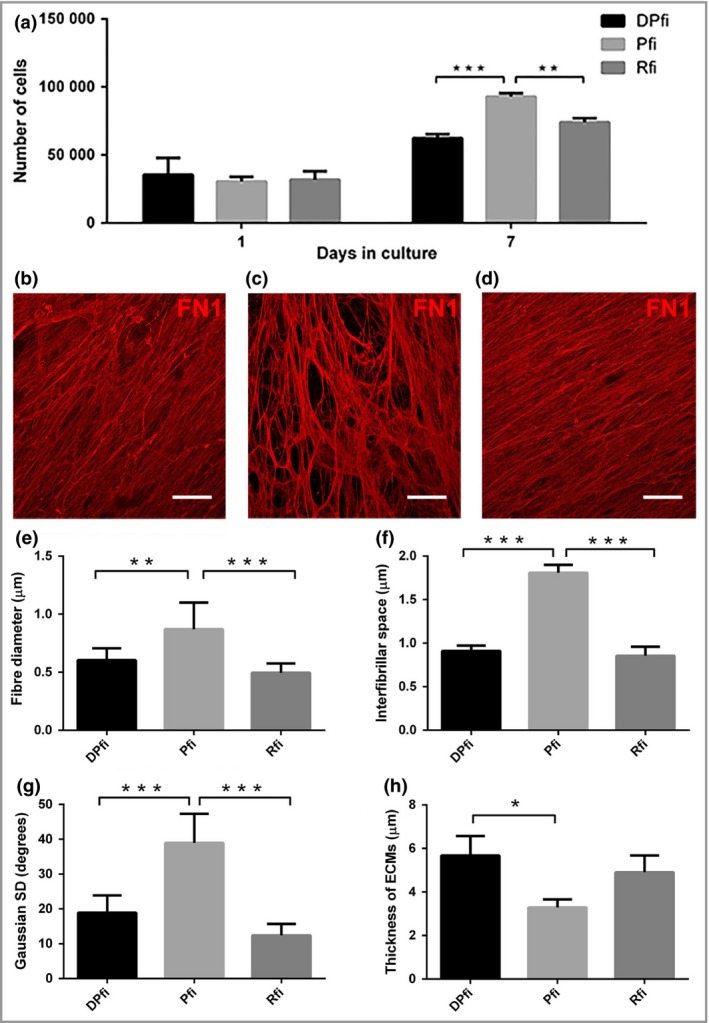
Morphological characterization of cell‐assembled extracellular matrices (ECMs). (a) Cell numbers, 1 and 7 days after seeding cells at equivalent densities, highlight fibroblast subtype‐specific differences. Representative immunofluorescence images of fibronectin 1 (FN1)‐stained ECMs generated by (b) dermal papilla fibroblasts (DPfi), (c) papillary fibroblasts (Pfi) or (d) reticular fibroblasts (Rfi) after 10 days in culture. Corresponding graphs determined from analysis of nine representative images show quantification of fibre diameter for each (e) cell‐assembled ECM, (f) interfibrillar space, (g) Gaussian SD of fibre orientation and (h) total ECM thickness. Data are mean ± SD (n = 3). *P < 0·05, **P < 0·01, ***P < 0·001. Scale bars in (a–c) are 50 μm.
