Figure 3.

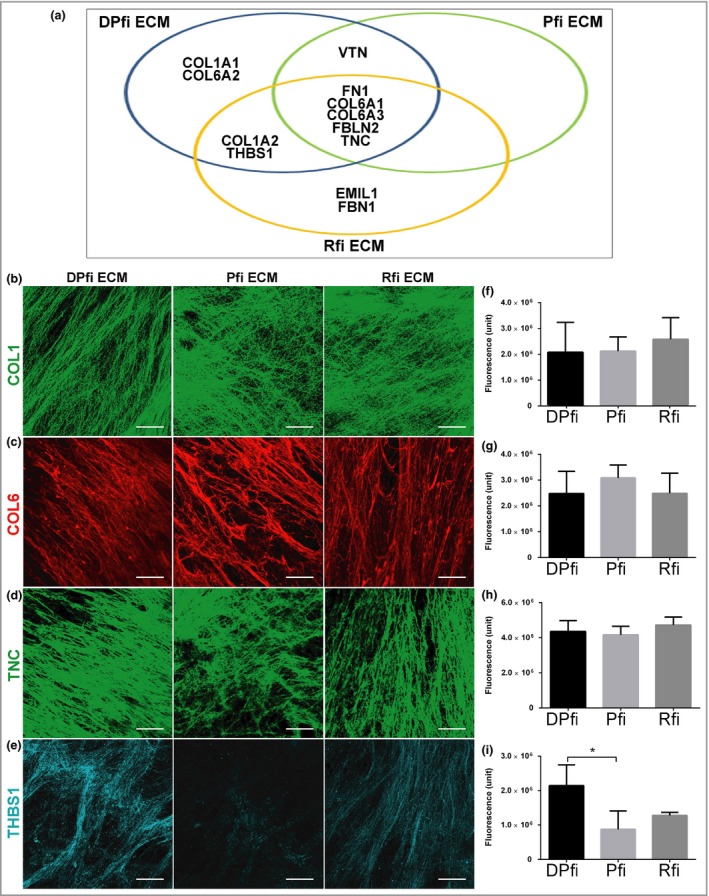
Extracellular matrix (ECM) composition. (a) Venn diagram showing distribution of 12 ECM components in matrices assembled from dermal papilla fibroblast (DPfi), papillary fibroblast (Pfi) and reticular fibroblast (Rfi). Representative immunofluorescence images of (b) collagen I (COL1), (c) collagen VI (COL6), (d) tenascin (TNC) and (e) thrombospondin 1 (THBS1) in ECMs generated by DPfi, Pfi or Rfi cells after 10 days in ascorbic acid‐supplemented medium. (f–i) Quantification of immunofluorescence is plotted in graphs as the mean ± SD (n = 3). *P < 0·05. Scale bars in (b–e) are 50 μm. COL1A1, α1 chain collagen I; COL6A2, α2 chain collagen VI; COL1A2, α2 chain collagen II; VTN, vitronectin; FN1, fibronectin 1; COL6A1, α1 chain collagen VI; COL6A3, α3 chain collagen VI; FBLN2, fibulin 2.
