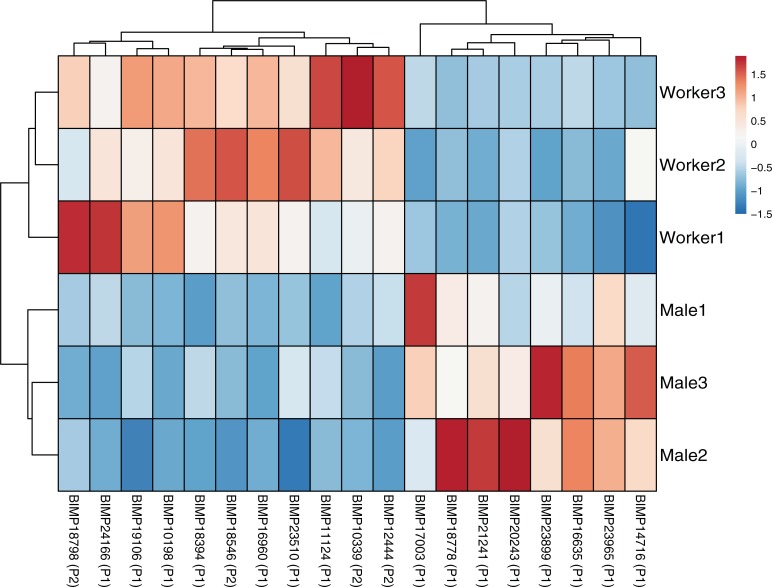
Fig 4. Heatmap showing the 25 putative detoxification genes that were differentially expressed between workers and males after 5 consecutive days of oral exposure to clothianidin.
Phase 1 (P1) detoxification processes include oxidation, hydrolysis, and reduction reactions while Phase 2 (P2) processes include conjugation reactions. Legend on the right shows relative fold change corresponding to each color.

