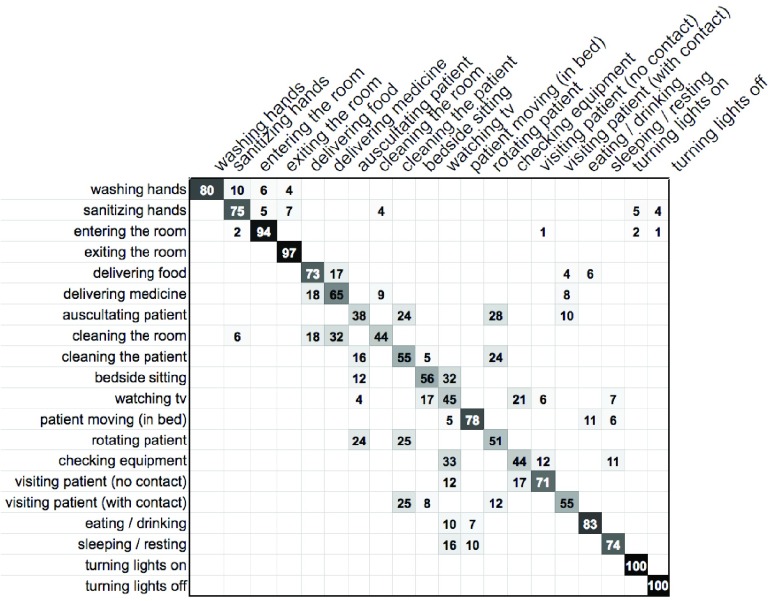
FIGURE 15.
Confusion matrix of the activity classification performance of HEAL using contextual aspects. The left column indicates the true activity labels, while the top row (vertical text) indicates predicted activity labels. Darker cells indicate better performance, while empty cells indicate zero. The values are rounded for displaying purposes in the range [0–100].

