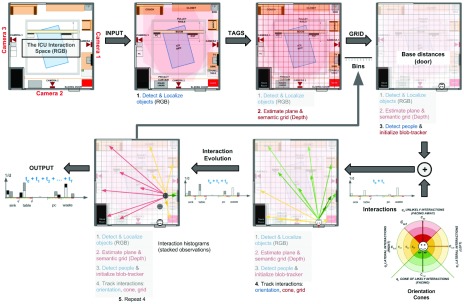
FIGURE 6.
The interaction overview diagram for role representation and identification. The cone, narrows down the activity search space and allows HEAL to infer which objects need to be included in the estimation and interaction based on their relative orientations and distances. The tracking and quantification steps are repeated throughout the observation.

