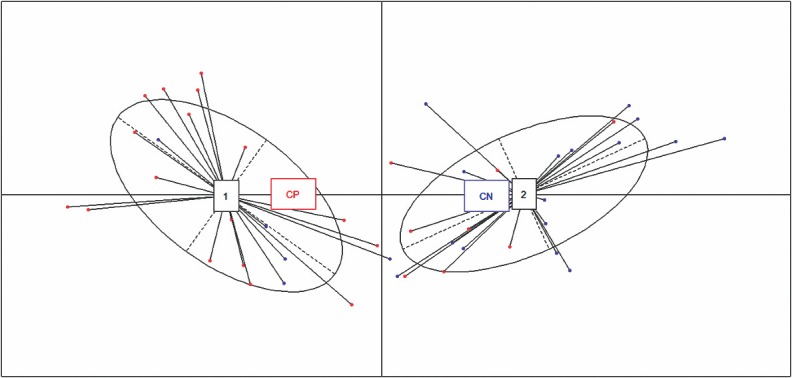
Fig 3. PCoA plot of all culture positive (CP) and culture negative(CN) vitreous samples showing two components using the 16 differentially expressed biomarkers.

The analysis depicts that cytokines from the CP and CN groups overlapped, and could not be distinguished.
