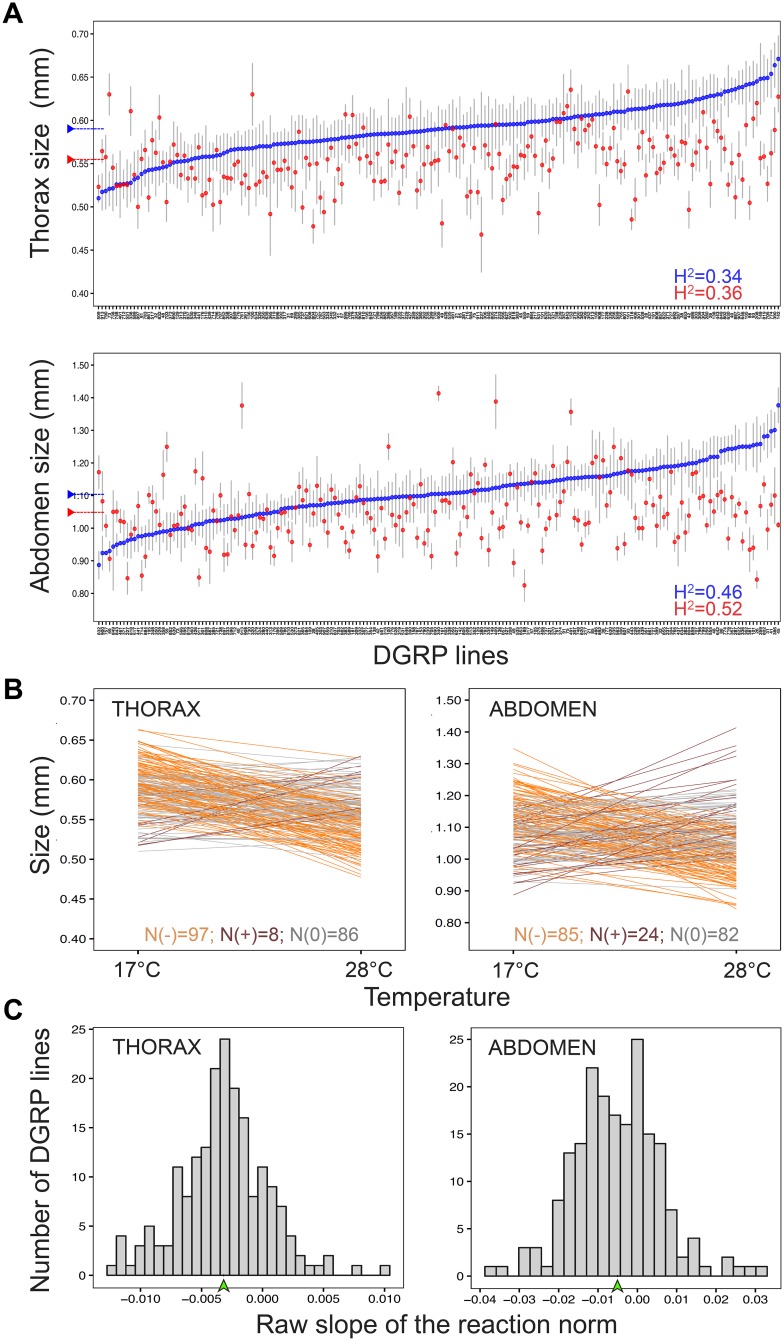
Fig 1. Natural genetic variation in size and size plasticity.
A. Means and 95% confidence intervals (Y axis) for thorax (upper panel) and abdomen (lower panel) size in the DGRP lines (X axis) reared either at 17°C (blue) or at 28°C (red). DGRP lines are ranked by their mean size at 17°C. Dashed horizontal bar represents the mean value for all DGRP lines at a given temperature. Mean values (μ) and broad sense heritability (H2) estimates per body part and temperature can be found in Table 1. B. Reaction norms for thorax and abdomen sizes (Y axis) across temperatures (X axis) plotted as the regression fit for the model lm (Size ~ Temperature) for each DGRP line. Reaction norms are colored by in relation to slope: slopes significantly different from zero are orange when positive and brown when negative, while slopes that were not significantly different from zero are gray (alpha = 0.05). Counts of each are shown on the bottom of each graph. Broad sense heritability estimates were: H2 = 0.33 (thorax plasticity) and H2 = 0.48 (abdomen plasticity). C. Frequency distribution for the raw value of the slope of the reaction norm in the DGRP lines. The mean value for the raw slope of all DGRP reaction norms is indicated with a green arrowhead.

