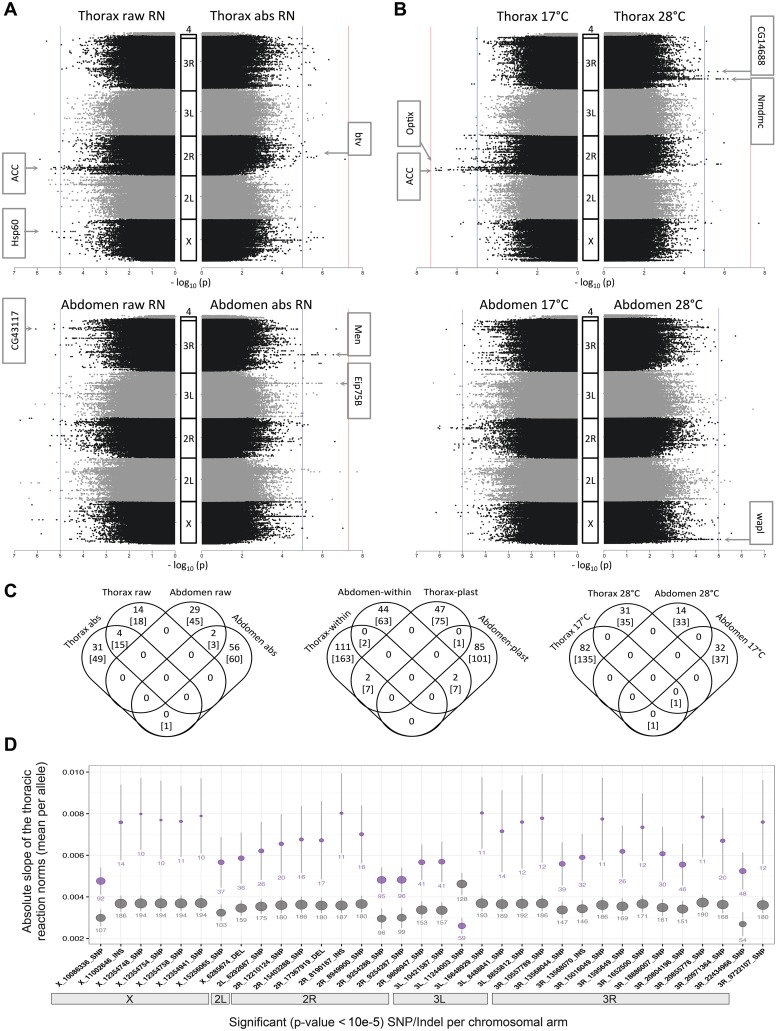
Fig 3. Genetic variants influencing size and size plasticity.
A-B. Manhattan plots corresponding to the eight GWAS analyses performed. Horizontal lines are p-value < 10e-5 (blue) and p-value < 10e-8 (red). Gene names are shown for a subsample of significant SNPs/Indels, which were selected based on p-value, putative variant effect and associated genes (S3 and S4 Tables). A. GWAS for variation in size plasticity in thoraxes (upper panels) and abdomens (lower panels) and for either the raw (left) or the absolute (right) slopes of the reaction norms. B. GWAS for variation in size in thoraxes (upper panels) and abdomens (lower panels) at 17°C (left panels) or 28°C (right panels). C. Venn diagrams showing the number of candidate SNPs/Indels (number outside the brackets) and candidate genes (number within brackets) harboring those polymorphisms identified in the different GWAS. D. Mean and 95% confidence interval of the absolute slope of the reaction norms for thorax size (Y axis) per allele (major allele in gray, minor allele in magenta) for each candidate plasticity QTL along the chromosomal arms (X axis). The position and identity of the polymorphisms in this figure is given by their annotation with Genome Release v.5.

