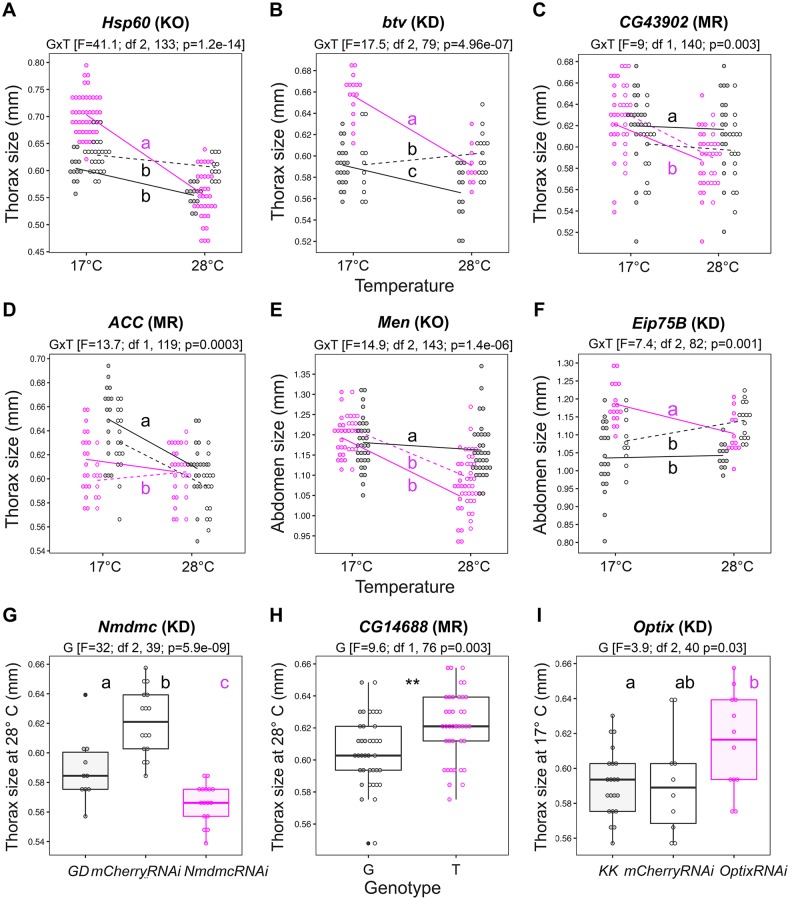
Fig 4. Functional validation of selected QTLs from GWAS analyses.
The name of the candidate gene and the method—mutant (KO), RNAi (KD), or Mendelian Randomization (MR)—to test the different candidate QTLs is shown above each plot. For validations via mutant or RNAi, genotypes with impaired gene function are shown in magenta and control genotypes are shown in black. Similarly, for validations via Mendelian Randomization, the two populations fixed for the minor allele are shown in magenta and the two populations for the major allele are shown in black. A. Reaction norms in mutant Hsp60A/+ and controls Canton-S (filled circles, solid line) and Fm7a/Canton-S (empty circles, dashed line). B. Reaction norms in btv-RNAi/bab-Gal4 and control lines KK (filled circles, solid line) and mCherry-RNAi/bab-Gal4 (empty circles, dashed line). C. Reaction norms in the four MR populations for SNP X:10192303 within gene CG43902. D. Reaction norms in the four MR populations for SNP 2R:7983239 within gene ACC. E. Reaction norms in Men mutants MenEx3/+ (filled circles, solid line) and MenEx55/+ (empty circles, dashed line) and control line w1118. F. Reaction norms in Eip75B-RNAi/bab-Gal4 and control lines KK (filled circles, solid line) and mCherry-RNAi/bab-Gal4 (empty circles, dashed line). G. Size at 28°C in Nmdmc-RNAi/tub-Gal4 and control lines GD (filled circles) and mCherry-RNAi/tub-Gal4 (empty circles). H. Size at 28°C in the four MR populations for SNP 3R:10678848 within gene CG14688. I. Size at 17°C in Optix-RNAi/bab-Gal4 and control lines KK (filled circles) and mCherry-RNAi/bab-Gal4 (filled circles). For the validations of plasticity QTLs, we tested the model lm (Size ~ Genotype*Temperature) and for the validations of within-environment QTLs we tested the model lm (Trait ~ Genotype). Results from the statistical models are shown above each plot and, when significant, indicated by asterisks in the plot (where p-values < 0.001 and < 0.01 are denoted by '***' and '**', respectively). Differences for more than two groups were estimated by post hoc comparisons (Tukey’s honest significant differences) and are indicated by different letters in each plot (p-value < 0.01). For all tested SNPs/genes, the phenotype of the DGRP lines carrying the minor versus the major allele at the target QTL can be found in S7 Fig.

