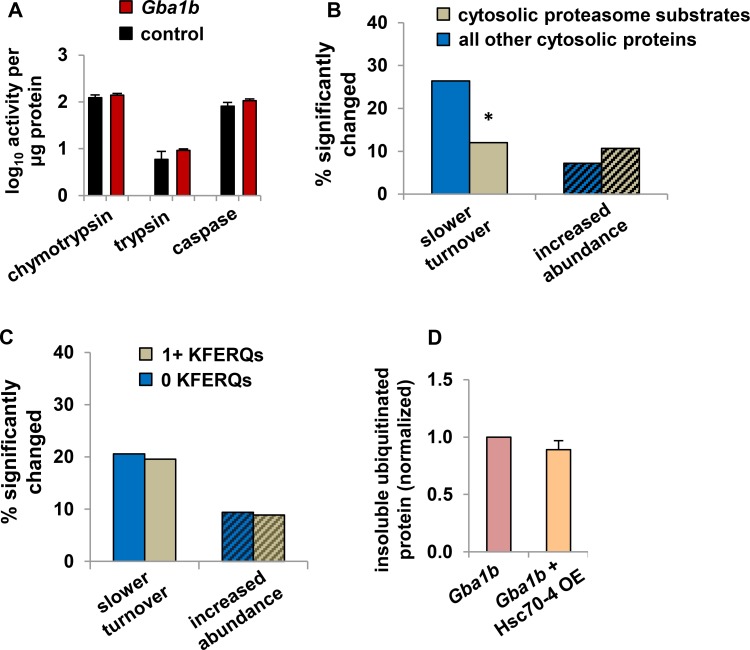
Fig 4. Proteasome activity and endosomal microautophagy are unaffected in Gba1b mutants.
(A) Measurement of proteasome activity from fly heads using fluorescent substrates, normalized to total protein, in Gba1b mutants and controls. Nonproteasomal (epoxomicin-insensitive) background activity was subtracted. Error bars represent SEM. (B) Percentage of cytosolic proteasome substrates (see Materials and Methods) with significantly slower turnover or increased abundance in heads from Gba1b mutants, compared to all other cytosolic proteins. Turnover: n = 100 substrate and 144 other proteins. Proteasome substrates are less likely than other proteins in the dataset to have slowed turnover (*p = 0.0062 by Fisher exact test). Abundance: n = 178 substrate and 375 other proteins; there was no significant difference between substrates and other proteins in the frequency of increased abundance by Fisher exact test. Solid bars indicate turnover and bars with diagonal lines indicate abundance. (C) Percentage of microautophagy substrate proteins with slower turnover or increased abundance in Gba1b mutants. There is no significant difference between cytosolic proteins with and without KFERQ-like microautophagy targeting sequences (Fisher exact test). For turnover, n = 138 proteins with and 107 without KFERQs; for abundance, n = 319 and 233. (D) Insoluble ubiquitinated protein in heads from 10-day-old Gba1b mutants with and without overexpression (OE) of Hsc70-4, measured by western blotting. Ubiquitin signal was normalized to Actin, and then expressed as a proportion of the normalized signal in sibling controls. There was no significant difference between genotypes by Student t test (p = 0.33). Error bars represent SEM. The results of three independent experiments are shown.

