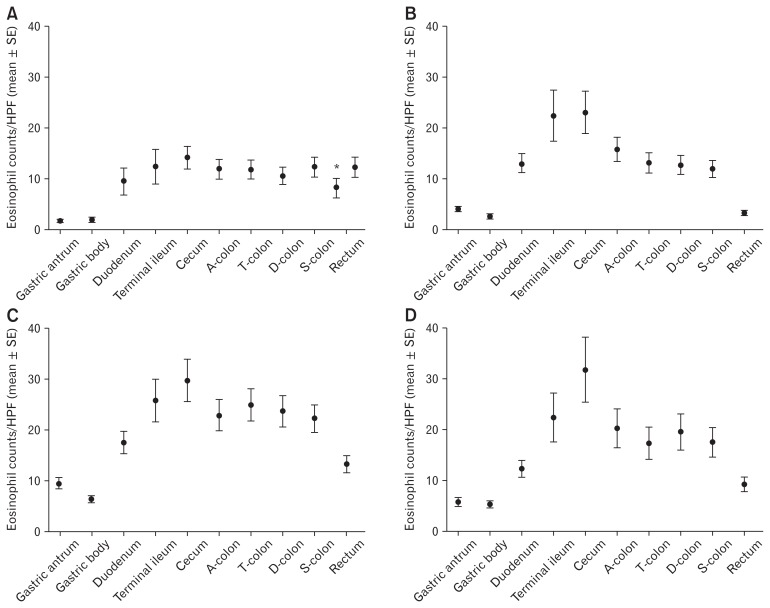
Figure 4.
Eosinophils distribution of whole gastrointestinal (GI) tract in normal controls (A), functional abdominal pain disorders (FAPDs) (B), inflammatory bowel diseases (IBD) (C), and IBD after selecting the GI tract segments endoscopically did not show macroscopic IBD involvement (D). The graph shows the tendency that eosinophils increased from the stomach to the cecum and decreased from the cecum to the rectum along the colon. The degree of this tendency was more prominent in the FAPDs and IBD than that observed in normal controls. Eosinophil counts were significantly high in the order of IBD, FAPDs, and normal controls, regardless of endoscopically detected macroscopic IBD lesions. In the rectum, eosinophil counts according to both upper GI reference and lower GI reference were presented because lower GI references presented the “rectosigmoid area,” with no clear division between the sigmoid and the rectum. HPF, high-power field; A-colon, ascending colon; T-colon, transverse colon; D-colon, descending colon; S-colon, sigmoid colon. The asterisk (*) means normal reference of rectum on the study by Debrosse et al.12

