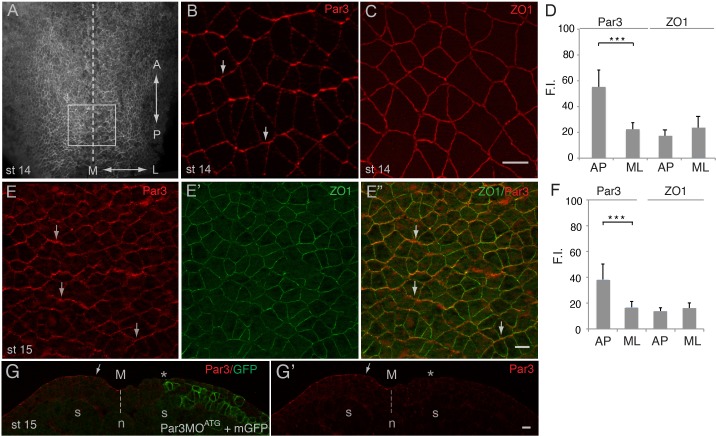
Figure 1. Planar polarization of Par3 in the Xenopus neural plate.
(A–C, E) Representative images show en face view of immunostained neural plate explants prepared from fixed Xenopus embryos at stages (st) 14–15. (A) Neural plate explant with the approximate position of the imaged area (B–E) (boxed). Dashed line indicates the neural midline (M). The anteroposterior (AP) and the mediolateral (ML) axes are shown. (B) Par3 is enriched at AP, horizontal, cell borders (arrows) as compared to ML, vertical, cell borders. (C) ZO1 is equally distributed to all junctions. (D, F) Fluorescence intensity (F.I.). Means ± s. d. represent three different experiments. At least 30 cells from three to four different embryos were analyzed per group. Significance was determined by the two-tailed Student’s t-test, p<0.001. (E–E”) Double staining with Par3 and ZO1-specific antibodies reveals planar polarization of Par3 but not ZO1 along the AP axis. (G, G’) Validation of the Par3 antibody. Cross-section of a neurula embryo, stage 15, unilaterally injected with Par3MOATG (20 ng, asterisk) and GFP-CAAX, membrane GFP (mGFP) RNA (100 pg) as lineage tracer. Arrow points to apical Par3 at the uninjected side, whereas the neural plate is flat on the injected side; n, notochord; s, somite, M, midline (dashed line). Control MO did not alter Par3 distribution (see Figure 2—figure supplement 3). Scale bars are 20 µm.

