. 2018 Sep 26;7:e37881. doi: 10.7554/eLife.37881

Figure 2. A requirement for Par3 in neural plate PCP and neural tube closure.

(A–F), Eight-cell embryos were unilaterally injected into two animal blastomeres with control morpholino 1 (CO MO1), 20 ng, or Par3MOATG, 20 ng, as indicated, with GFP RNA, 0.1 ng, as a lineage tracer. Dorsal view is shown, and the anteroposterior (AP) axis of the neural plate and embryonic stage 15 (st 15) are indicated. (A–C) Par3 depletion results in neural tube defects. Arrow points to the open neural fold. (C) Frequencies of neural tube defects were scored by the lack of neural fold formation. Numbers of scored embryos per group are shown above each bar. (C’) Partial rescue of the defect with Par3 RNA, 0.2 ng, is shown. Data are from three different experiments. (D–F), Embryos were injected as described above. Neural plate cells mosaically depleted of Par3 (labeled by GFP) lack Vangl2 enrichment at the anterior border of each cell (asterisks) as compared to control GFP-negative cells (arrows). D', D'', F', F'' are single-channel images corresponding to D and F. CO MO1 injection had no effect on the anterior distribution of Vangl2. Scale bar, 20 µm. (E) Quantification of data from the experiments with Par3MOATG showing mean frequencies ± s. d. of cells with anterior Vangl2. At least 5–10 embryos were examined per each treatment. Numbers of scored cells are shown on top of each bar. Co, uninjected control. (G) Immunoblot analysis of Vangl2 in embryo extracts. Xenopus embryos were injected with the indicated MOs into animal pole blastomeres at the two-cell stage and collected at stage 13 for immunoblotting (IB) with Vangl2 antibodies. Asterisk marks a non-specific band indicating loading. Uni, uninjected.

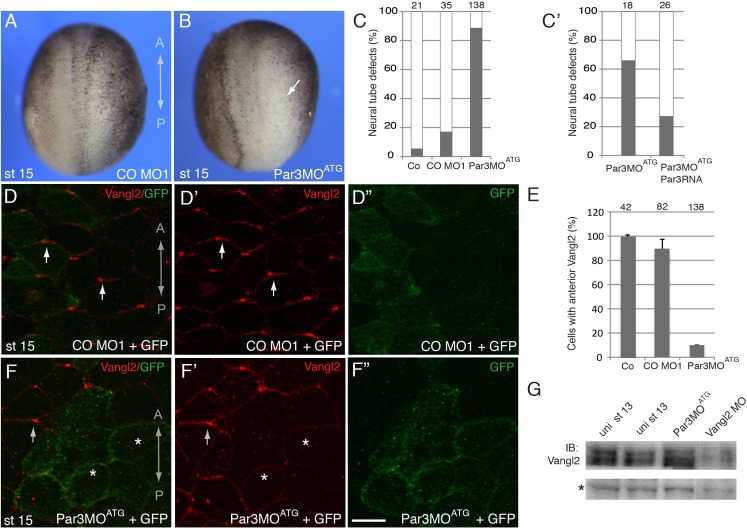
Figure 2.

Figure 2—figure supplement 1. Depletion of Par3 with Par3MO5’UTR causes neural tube closure defects.

Figure 2—figure supplement 1.

(A) Four-to eight-cell embryos were injected with Control MO2 (CO MO2) and Par3MO5’UTR into each of the animal blastomeres (10 ng per blastomere). Ectoderm explants (animal caps) were prepared from the injected embryos at midblastula stages. The explants were lysed at the equivalent of stage 14 for immunobloting with anti-Par3 and anti-β-catenin antibodies. The decrease in the intensity of two bands is observed in Par3MO5’UTR but not CO MO2 injected explants (arrowheads); β-catenin is a control for loading. Band intensity ratios of the highest molecular weight Par3 isoform to β-catenin are shown. This ratio is set to one in uninjected explants. (B) Eight-cell embryos were unilaterally injected into two animal blastomeres with CO MO2, 20 ng, or Par3MO5’UTR, 20 ng, as indicated. Dorsal view is shown, and the anteroposterior (AP) axis of the neural plate is indicated. (B, C) Par3 depletion results in neural tube defects. Arrow points to the open neural fold, asterisk indicates the injected side. (C) Frequencies of neural tube defects were scored by the lack of neural fold formation at the injected side. Numbers of scored embryos per group are shown above each bar. Data are representative of two experiments.
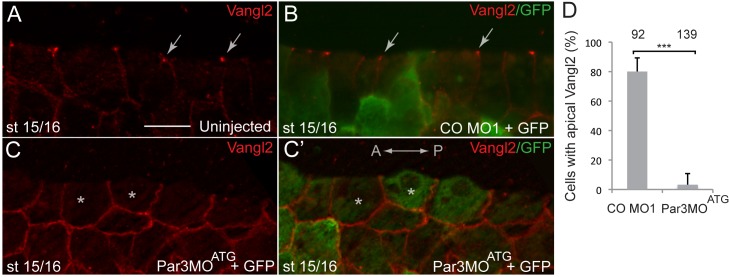
Figure 2—figure supplement 2. Par3MOATG inhibits apical accumulation of Vangl2 at the neural plate midline.

Figure 2—figure supplement 2.

Sagittal sections of stage 15/16 embryos were immunostained with anti-Vangl2 and anti-GFP antibody. The anteroposterior (AP) axis is indicated. Apical surface is at the top. (A, B) Vangl2 is enriched at the apical corners of cells at the neural midline in uninjected and CO MO1-injected embryos (arrows). (C, C’) Basolateral localization of Vangl2 at the cell junctions of Par3MOATG-injected embryos (asterisks). (D) Quantification of apical Vangl2 staining in CO MO1 and Par3MOATG-injected tissue. Number of counted cells is shown above the bars. Error bars represent standard deviation. Significance was determined by the two-tailed Student’s t-test, p<0.001 (asterisks). Scale bar, 20 mm.
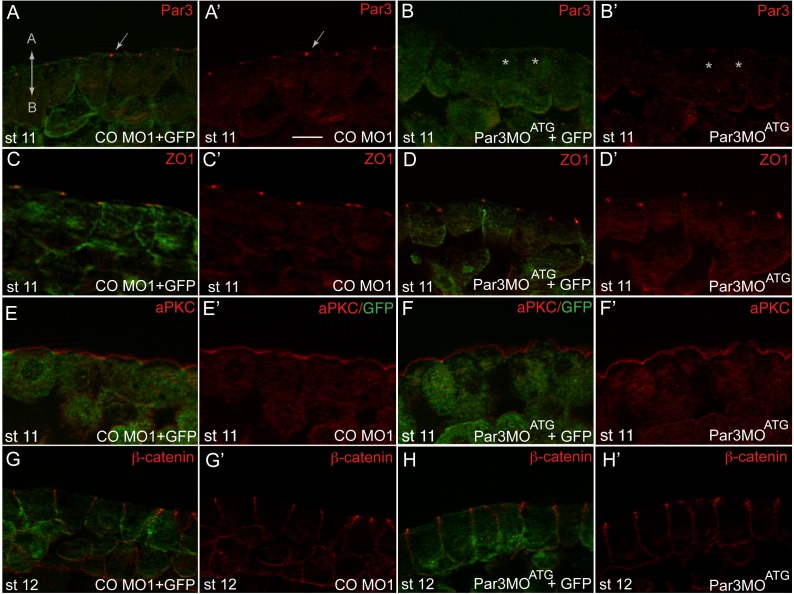
Figure 2—figure supplement 3. Par3 depletion does not affect the localization of aPKC, b-catenin and ZO1 in gastrula ectoderm.

Figure 2—figure supplement 3.

Early embryos were injected with control morpholino (CO MO1) or Par3MOATG (20 ng each) and GFP RNA (100 pg) as a lineage tracer, cultured until stage 11 or stage 12, sectioned and stained for junctional, polarity markers and GFP as indicated. CO MO1 has no effect on (A) Par3 (arrow), (C) ZO1, (E) aPKC and (G) b-catenin. (B, D, F, H) Par3MOATG reduced levels of (B) Par3 (asterisks), but not (D) ZO1, (F) aPKC or (H) b-catenin. (A–H) merged images showing co-staining with GFP. Scale bar, 20 µm. Apicobasal (A–B) axis is indicated. Images are representative of 3 independent experiments, each containing 15–20 embryos per group.
Figure 2—figure supplement 4. Planar polarity of Par3 is lost in Vangl2-depleted cells in the neural plate.

Figure 2—figure supplement 4.

(A, B) En face view of immunostained neural plate explants from fixed Xenopus embryos at stages 15/16. The anteroposterior (AP) axis is shown. (A) Par3 is enriched at the anteroposterior cell borders in untreated cells. (B, B’) Polarization of Par3 at the anteroposterior cell borders is no longer detected in Vangl2 MO injected cells (asterisks). (C) Results are shown as means ± s. d., with each group containing ten embryos. At least 15 cells from two embryos were analyzed per group. F.I., Fluorescence intensity. The experiment was repeated two times. Scale bar, 20 µm.