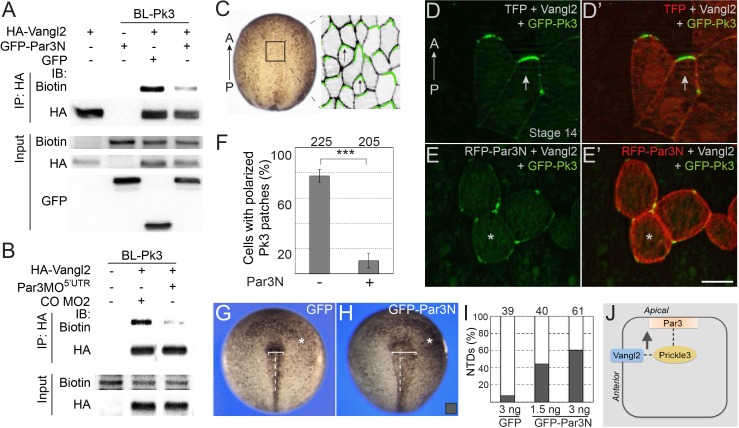
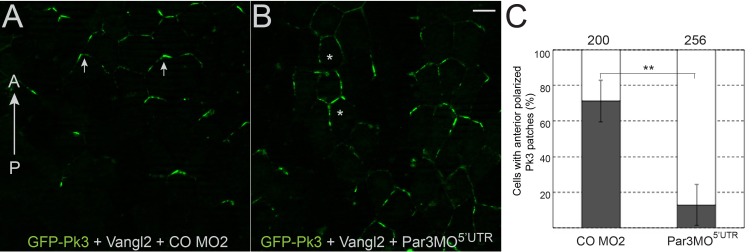
Figure 7. Par3 is required for the interaction of Pk3 and Vangl2 in vivo.
(A, B) Decrease of Vangl2 biotinylation by BL-Pk3 (see Figure 3) in embryos injected with Par3MO or Par3N RNA. Embryos were coinjected into animal blastomeres with biotin and RNAs encoding BL-Pk3, 0.1 ng, and HA-Vangl2, 50 pg, GFP, 1 ng, GFP-Par3N, 1 ng (A), or MOs (CO MO2 or Par3MO5’UTR, 10 ng each, (B) as indicated. Biotinylated HA-Vangl2 was detected with anti-biotin antibodies in pulldowns with anti-HA antibodies. (A, B). Protein expression levels in stage 13 embryos were assessed by immunoblotting of lysates with anti-HA, anti-GFP and anti-biotin (for FLAG-BL-Pk3 protein) antibodies (A, B). (C–I) Par3N disrupts neuroepithelial PCP. (C–E) Two dorsal blastomeres of 16 cell embryos were injected with GFP-Pk3 RNA, 100 pg, HA-Vangl2 RNA, 25 pg, and Turbo FP635 (TFP) RNA, 0.1 ng, or RFP-Par3N RNA, 0.4 ng. Injected embryos were cultured until stage 14, fixed and the neural plate explants were imaged. (C) En face view of a neurula embryo. Polarized cells from the boxed area used for imaging are shown schematically on the right. Anterior PCP complexes are in green (arrows), the anterior-posterior (AP) axis is indicated. (D–E’) Representative images. (D, D’) Anterior enrichment of Pk3/Vangl2 complexes (arrows) in a control embryo. (E, E’) Lack of PCP (asterisks) in a Par3N-expressing embryo. Scale bar, 20 µm. (F) Frequencies of neuroepithelial cells containing polarized Pk3 cortical patches. Means ± s. d. are shown for three independent experiments. Total numbers of scored cells are above each bar. Significance was determined by the two-tailed Student’s t-test, p<0.001 (asterisks). (G–I) Neural tube defects in representative stage 17/18 embryos unilaterally injected with GFP RNA (3 ng, (G) or GFP-Par3N RNA (3 ng, (H). Asterisk indicates the injected side. Note the difference in the distance between the neural fold and the midline (white line) at the injected side as compared to the uninjected side. (I) Frequencies of neural tube defects shown in G, H. Numbers of embryos from two experiments are shown above each bar. (J) Working model: Par3 recruits Pk3 to the apical surface to promote the interaction of Pk3 and Vangl2 at the apical junctions that is necessary for planar polarization.


