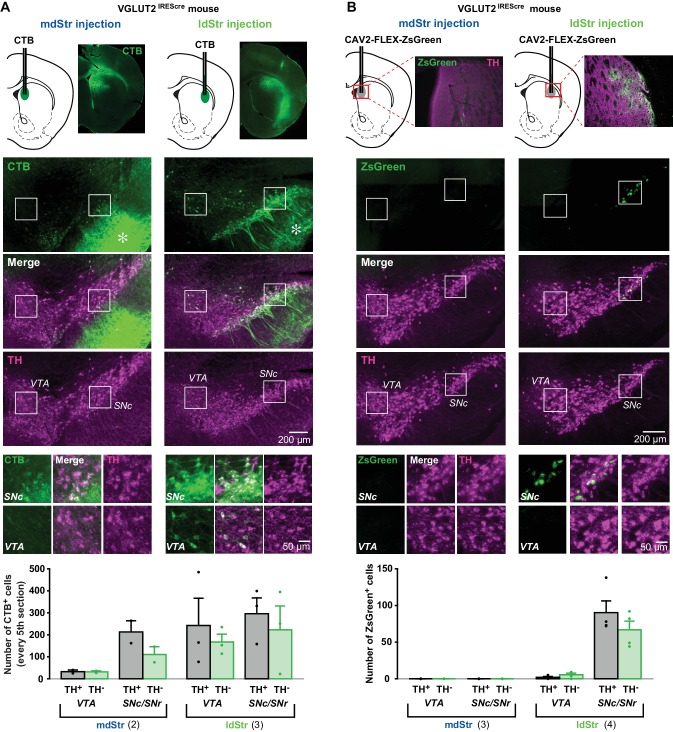
Figure 8. Substantia nigra DA neurons mediate glutamate cotransmission in the ldStr.
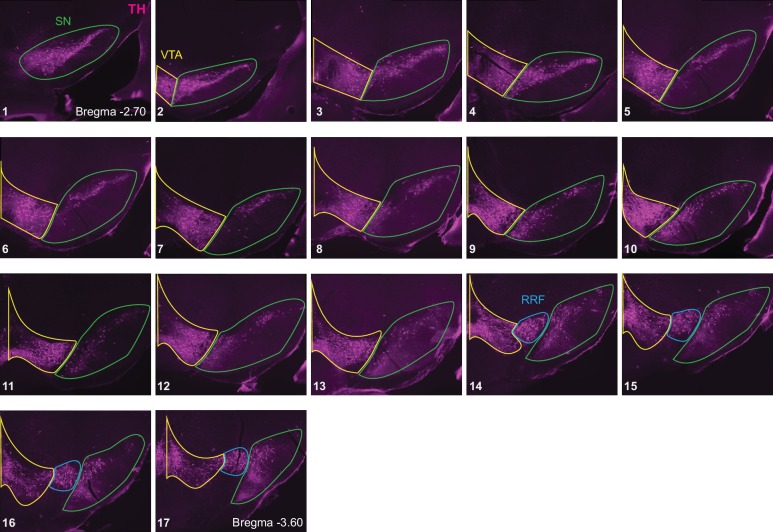
Retrograde tracer injections in the dStr of VGLUT2IREScre mice. (A) Top row shows CTB injection sites (schematics) and CTB immunostaining in the Str. The bright green diffuse staining surrounding the injection site reflects CTB uptake by locally connecting Str neurons, which are filled in their entirety. Middle three rows show low magnification images of CTB (green) and TH (magenta) staining in the VTA and SN, with merge images in between. Robust anterograde labeling of Str neuron projections is seen in the SNr (asterisks). White squares outline regions shown at higher magnification in the bottom row. (B) Top row shows CAV2-FLEX-ZsGreen injection sites and ZsGreen fluorescence of transduced VGLUT2+ neuron terminals in the Str. TH immunostaining (magenta) was done as a counterstain to show Str boundaries. Middle three rows show low magnification images of ZsGreen fluorescence (green) and TH immunostaining in the VTA and SN (magenta), with merge images in between. White squares outline regions shown at higher magnification in the bottom row. All images are in the same orientation as the schematics. Graphs show cell counts in the VTA and SN (SNc and SNr combined) for CTB and CAV2-FLEX-ZsGreen. CTB counts were made from every fifth section; ZsGreen counts were made from all sections. White bars indicate numbers of TH+/tracer+ cells; green bars indicate numbers of TH–/tracer+ cells. Dots show cell counts for each animal. Cell count for CTB: chi-square 163.0, exact significance 0.000 (Pearson’s chi-square test). Cell count for ZsGreen: injection location/cell body location interaction, F = 20.2, p=0.006 (mixed ANOVA); post-hoc comparison between injection sites: VTA p=0.16, SN p=0.011. Numbers of animals used are in parentheses. For delineation, see Figure 8—figure supplement 1.


