
Author response image 1. Investigation of parameters potentially influencing variability in gene fitness calculation.
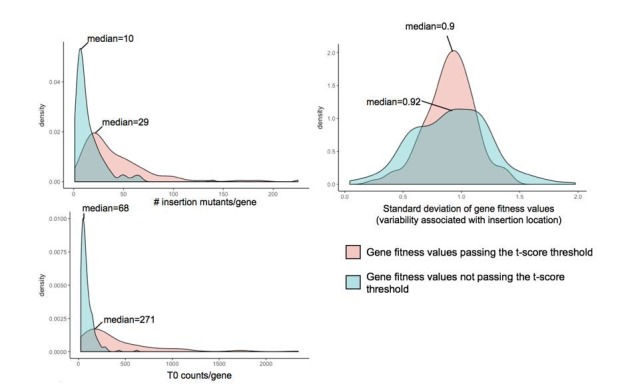
Here, we compare (i) the number of insertion mutants/gene, (ii) the number of counts/gene in the T0 sample and (iii) the variability associated with insertion location, for genes with fitness values that pass the t-score threshold and genes with strong fitness values (fitness values >0.5 or <-0.5) that don’t pass the t-score threshold.