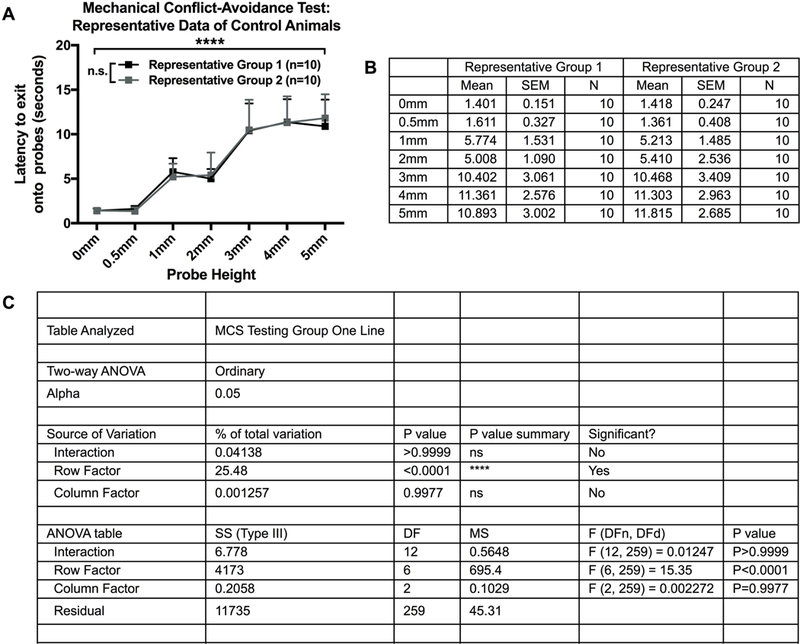
Figure 4.

Representative stimulus-response data of control animals (A) Stimulus-response curves of control animals split into two equivalent groups based on ‘latency to exit onto the probes’ data. Represents anticipated baseline stimulus-response curves after proper group splitting, which produces similar stimulus-response curves between groups and non-significant differences at each probe height (N=20, n=10/group). B) Descriptive statistics of mean, standard error of the mean, and sample size of ‘latency to exit onto the probes’ data from control animals split into two equivalent groups (N=20, n=10/group). (C) Statistical analysis of a two-way between-subjects ANOVA for anticipated baseline stimulus-response data after splitting animals split into two equivalent groups (N=20, n=10/group). There should be a significant effect of probe (row factor; p<0.05), indicating the latency to exit onto the probes (pain avoidance) changes at different probe heights. If the groups were split correctly, there should not be a significant effect of group (column factor; p>0.05) or an interaction effect (interaction; p>0.05).
