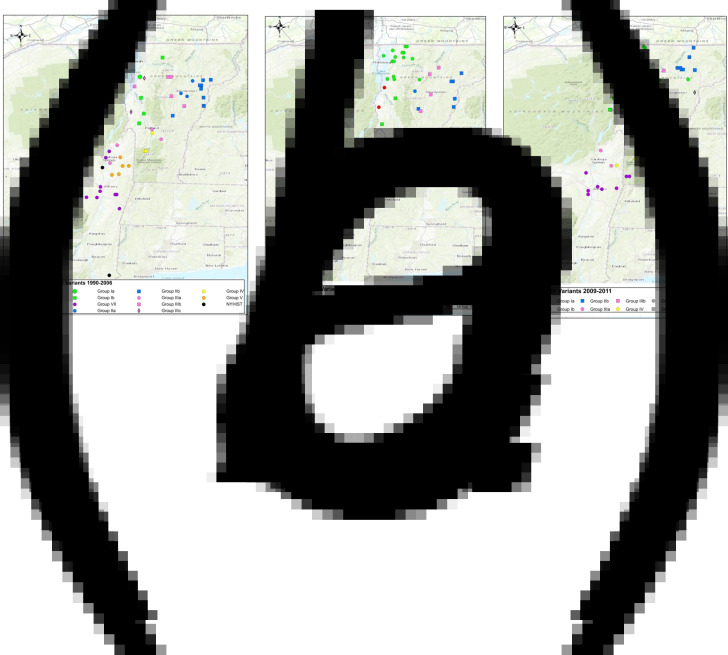
Fig. 3.
Maps of Vermont and neighbouring regions showing the spatial distribution of RRV variants (colour-coded as in Fig. 2) over three periods: (a), 1990–2006; (b), 2007–2008; (c), 2009–2011. Each viral group and sub-group represented is identified in the key at the bottom of the map. Only samples from Vermont and New York are shown due to lack of detailed spatial data for samples from other states.

