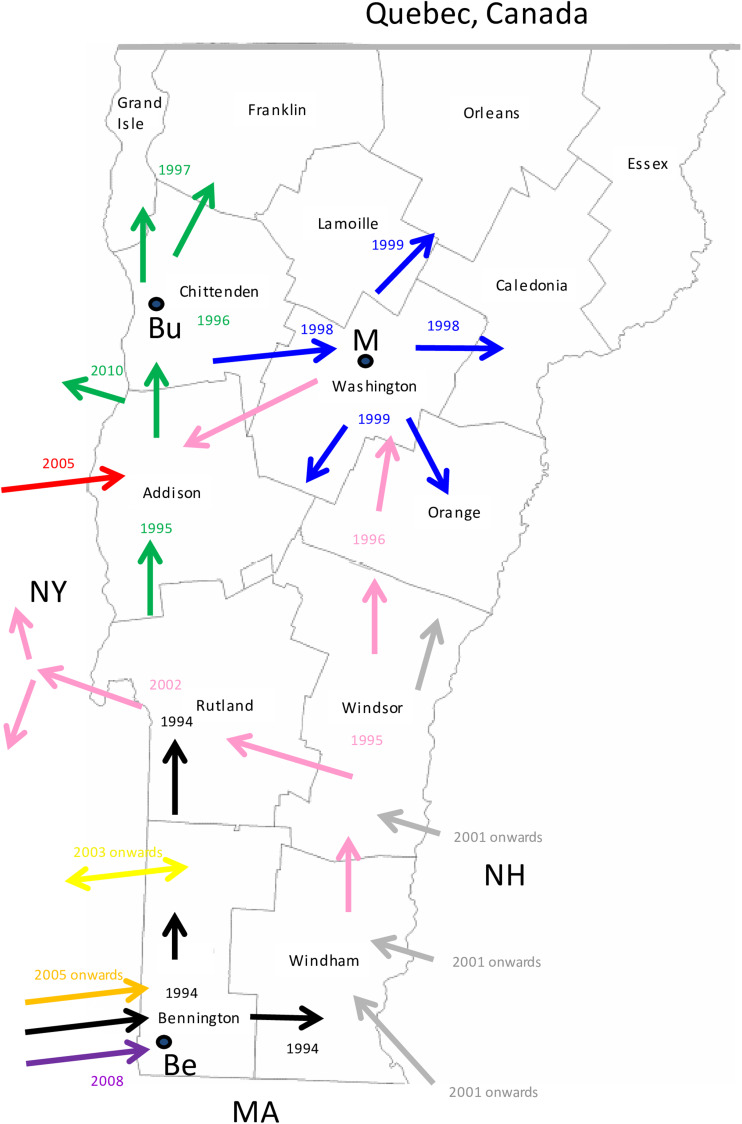
Fig. 5.
A map of the state of Vermont showing the counties and the proposed direction of movement of the RRV variants identified in this study. Arrows are colour coded to represent the progenitor of Groups I, II and III (black) and the 8 VT groups as in Figure 2. The year in which the viral group entered an area is also indicated with the same colour coding. The locations of the following towns are indicated thus: Be, Bennington; Bu, Burlington; M, Montpelier.

