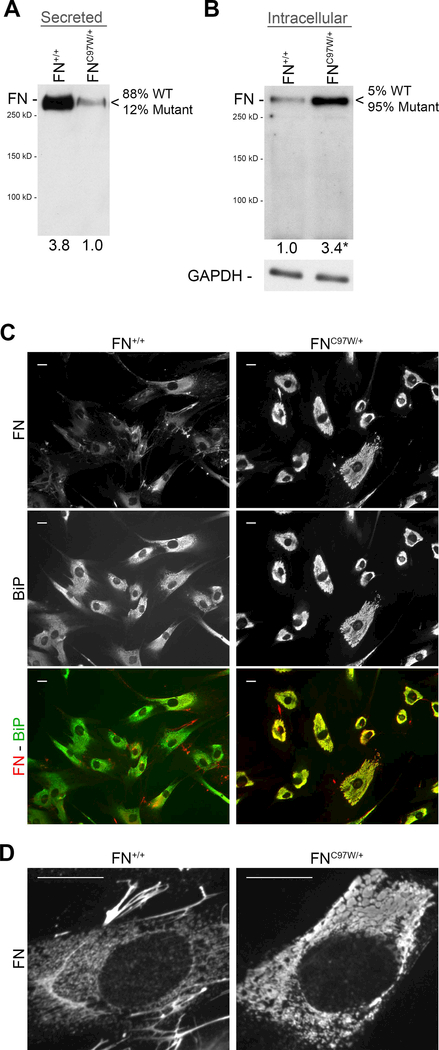
Figure 4: Altered subcellular distribution of FN in primary FNC97W/+ cells.
(A) Wild type (FN+/+) and mutant (FNC97W/+) cells were plated for 24 hours, then media were immunoblotted for human FN with HFN7.1 monoclonal antibody. Band quantification demonstrated at least 3.8-fold more FN secreted by FN+/+ cells compared to FNC97W/+ cells. The relative percentage of wild type (WT) and mutant peptides determined by mass spectrometry is shown (see Supplementary Figure S2D). (B) Subconfluent cells were lysed after 24 hours in culture to enrich for cellular proteins over ECM proteins. 1 μg of lysate was probed for human FN (top) or GAPDH as a loading control (bottom). Intracellular FN level was, on average, at least 3.4-fold higher in FNC97W/+ cells compared to FN+/+ cells (p<0.01). (C) Wild type FN+/+ (left) and mutant FNC97W/+ (right) cells were seeded at a low density to minimize matrix formation. Cells were fixed, permeabilized, and then stained with anti-FN antiserum (red) and anti-BiP monoclonal antibody to visualize the endoplasmic reticulum (green). Individual channels and merged signals are as indicated on the side. (D) High magnification imaging of cells from (C) stained for FN shows vesicles in FN+/+ cells (left) compared to large FN-positive inclusions in FNC97W/+ cells (right). Scale bar = 20 μm.

