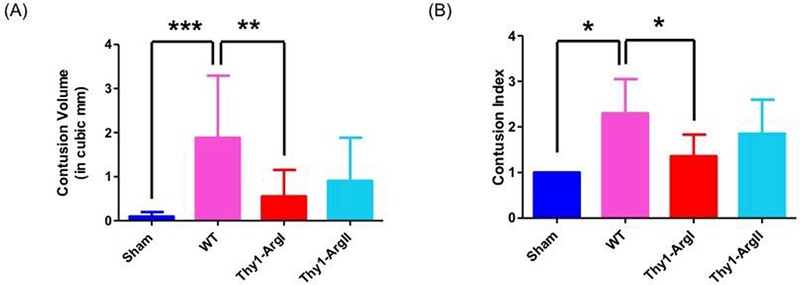
Figure 6.

(A) Graph depicting average volume of contusion by experimental group and genotype. As expected, WT mice had significantly higher contusion volume as compared to the sham group. The contusion volume was significantly reduced in the Thy-1 ArgI mice compared to WT mice while the contusion volume in Thy1 Arg II mice trended towards being significantly reduced as compared to WT mice. (B) Graph depicting average contusion index by experimental group and genotype. As expected, WT mice had significantly higher contusion index as compared to the sham group. The contusion index was significantly reduced in the Thy-1 ArgI mice compared to WT mice while the contusion index in Thy1 Arg II mice was not significantly different than WT mice. For the contusion volume and contusion index measurements, the sham group had n=3. For the WT and transgenic mice, n=7–15 mice. Error bars depict standard deviation. Single asterisk (*) denotes p≤0.05, double asterisk (**) denotes p≤0.01, triple asterisk (***) denotes p≤0.001.
