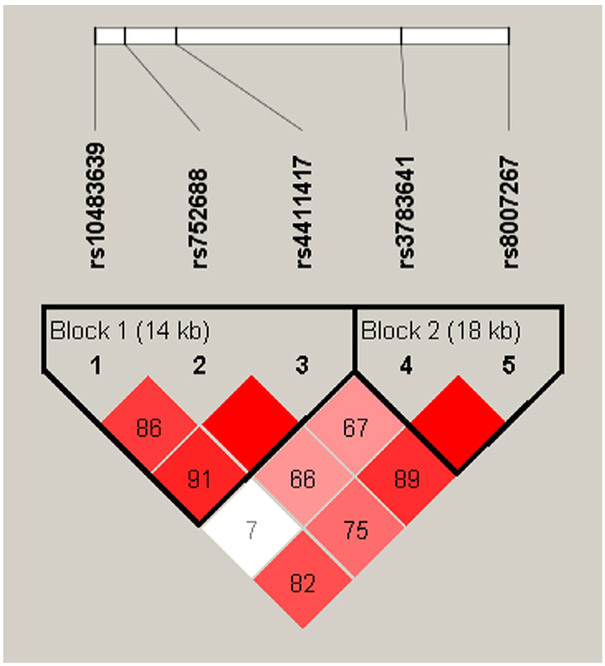
Figure 1.
Linkage disequilibrium plot for GCH1 SNPs: Linkage disequilibrium plot was generated from Haploview 4.2 using the standard D’/LOD color scheme. D’ values show the linkage disequilibrium coefficient. LOD= logarithm of odds of two loci having linkage disequilibrium. Red= high D’ and high LOD, white= low D’ and low LOD; shades of pink/red= low D’ and high LOD.

