Figure 1.

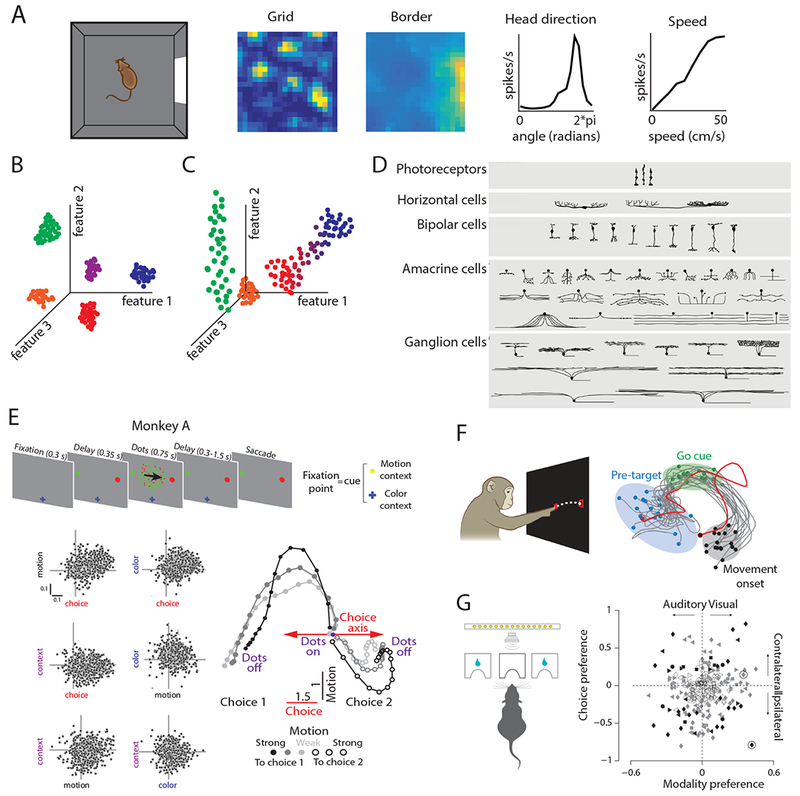
The range at which clear cell-type clustering emerges varies across neural circuits. A. Left-most panel: schematic of the open field foraging paradigm often used to identify MEC neurons in rodents. Right panels: example tuning curves of grid, border, head direction, and speed cells. Spatial tuning curves are color coded for minimum (blue) and maximum (yellow) values. [Reproduced from Hardcastle et al., 201716]. B. Schematic of cell-type clusters in an arbitrary feature space. Each point represents a cell, and is colored by the cluster to which it belongs. In this example, all cell-types cluster along each feature independently. C. Schematic of challenges to clustering cell-types in an arbitrary feature space. The green cells only cluster along one axis, the red and blue cells exist along a continuum, and the orange cells do not exhibit significant values for these features. D. Schematic of retinal ganglion cell-types. [Reproduced with permission from Masland 200177]. E. Schematic of task employed in Mante et al., 201313 and observed cell responses along task parameters. Top: schematic of task, in which a monkey must choose the correct target that corresponds with the dominant motion or color of the presented dots. Bottom left: cell responses along motion, choice, color, and context axes. Responses are the de-noised regression coefficients from a multivariate linear regression model. Bottom right: Schematic of the dimensionality-reduced population level response during the motion context, projected onto the axes of choice and motion. [Reproduced with permission from Mante et al., 201313]. F. Left: schematic of reaching task to assess preparatory activity in motor cortex. Right: Example motor neural activity, projected into a 2-dimensional latent space, during reaching. Blue dots indicate 100 ms before target onset, green dots indicate time of go cue (when the reach could commence), and the black dots denote the neural activity at the time of movement onset. [Reproduced with permission from Shenoy et al., 201334]. G. Left: schematic of task used in Raposo et al., 201412. In this task, the rat chose the left or right port based on the visual, auditory or combined visual-auditory stimulus. Right: Modality (visual or auditory) versus choice (left or right) preference for cells recorded in posterior parietal cortex during this task. Preference for the task variables was computed from the area under the receiver operating characteristic curve; for example, a value of +1 for choice preference indicates the neuron always firing more during trials with a contralateral choice. The absence of clustering in this space indicates a lack of functional cell-types. [Reproduced from Raposo et al., 201412].
