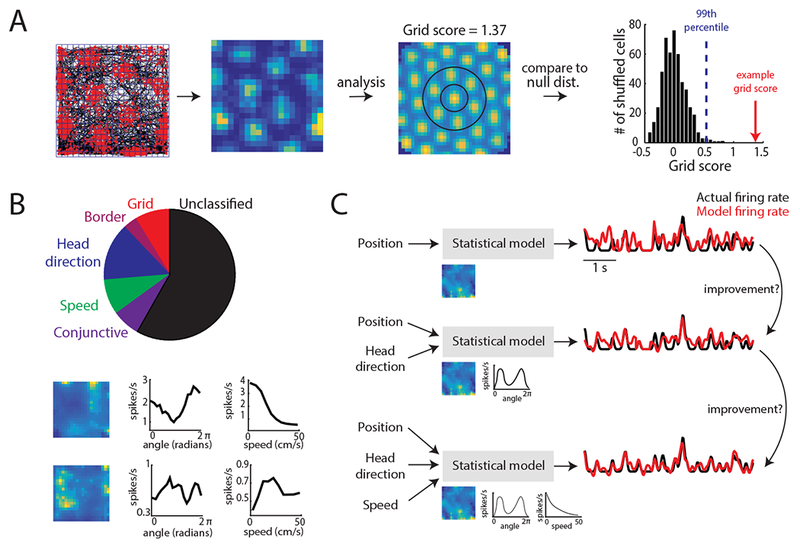
Figure 2.

Capturing coding in MEC using a tuning curve score versus model-based method. A. Schematic of the tuning curve and score method conventionally used to characterize grid cells and other functionally-defined MEC neurons47, 78. Far-left: Spatial tuning of a grid cell in a 1 × 1 m open arena. Red dots denote neural spikes and black lines indicates the animal’s trajectory. Blue lines denote the spatial bins used to generate firing rate tuning curves. Middle-left: firing rate tuning curve. Each pixel corresponds to the average spikes/second of the grid cell at that binned spatial position and is color coded for minimum (blue) and maximum (yellow) values. Middle-right: spatial autocorrelation of the tuning curve. To generate a grid score, the inner ring of fields (circled in black) is first rotated 30, 60, 90, 120, and 150 degrees and correlated to the original ring. The grid score is the minimum correlation at 60 or 120 degrees minus the maximum correlation at 30, 90, or 150 degrees. Right: distribution of 500 grid scores generated by adding a random amount to the spike train (modulo the length of the session) of the given cell, and re-computing the grid score. The blue line denotes the 99th percentile of the shuffled distribution, while the red arrow indicates the actual grid score for this example cell. B. Top: Pie chart of MEC cell classifications based on the score method. Based on dataset used in Hardcastle et al., 201716. Bottom: Examples of position (left), head direction (middle), and speed (right) tuning curves that are not characterized by the score method. C. Schematic of a model-based approach using the forward-search method to identify the set of navigational variables encoded by the cell. In this approach, position, head direction, and speed information are used to predict neural spikes (black and red lines). The model uses this information by learning a set of parameters (images under ‘Statistical model’) that transform the animal’s position, head direction, or speed to firing rate. Single-variable contribution to neural spiking can be assessed by analyzing the performance of the simplest model (top of diagram) and continually adding variables to this model to see if performance improves.
