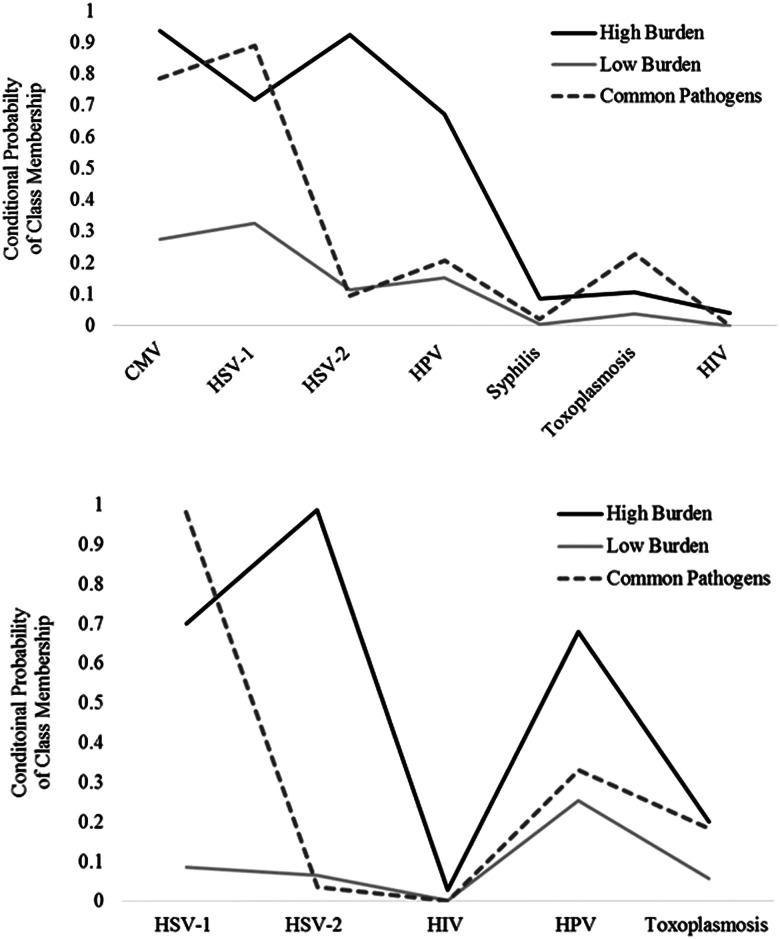
Fig. 1.
(a) The conditional probability of each infection given a three class solution for the National Health and Examination Survey, 2003–2004 wave (N = 2168). (b) The conditional probability of each infection given a three class solution for the National Health and Examination Survey, 2009–2010 wave (N = 2546).

