. 2018 Oct 1;2(4):442–463. doi: 10.1162/netn_a_00039

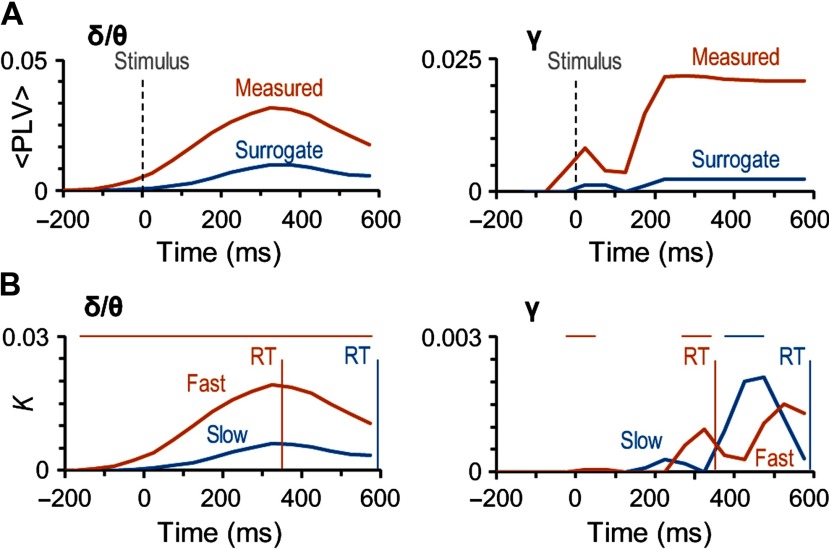
Figure 4. Gamma- and delta/theta-band synchronization is not artificial and predicts the speed of sensorimotor decisions. (A) The mean coupling strength (<PLV>) for the significant edges for Hits in the original (red line) and surrogate data (blue line) in delta/theta- (δ/θ) and gamma- (γ) frequency bands. (B) Connection density (K) as a function of time for the difference between Hits and Misses separately for trials with fast (red) and slow (blue) RTs. Vertical lines show the mean RT in these two categories: 356 ± 122 ms (mean ± SD across subjects) for the trials with fast RTs and 594 ± 229 ms for the trials with slow RTs. The horizontal bars above the plots show the time window in significant difference between trials with fast and slow trial RTs (Wilcoxon signed-ranked test, p < 0.05, corrected for multiple comparisons). The trials were split at the median RT of each subject and the mean of these median RTs was 464 ± 142 ms (mean ± SD across subjects).

Figure 4.