. 2018 Oct 1;2(4):442–463. doi: 10.1162/netn_a_00039

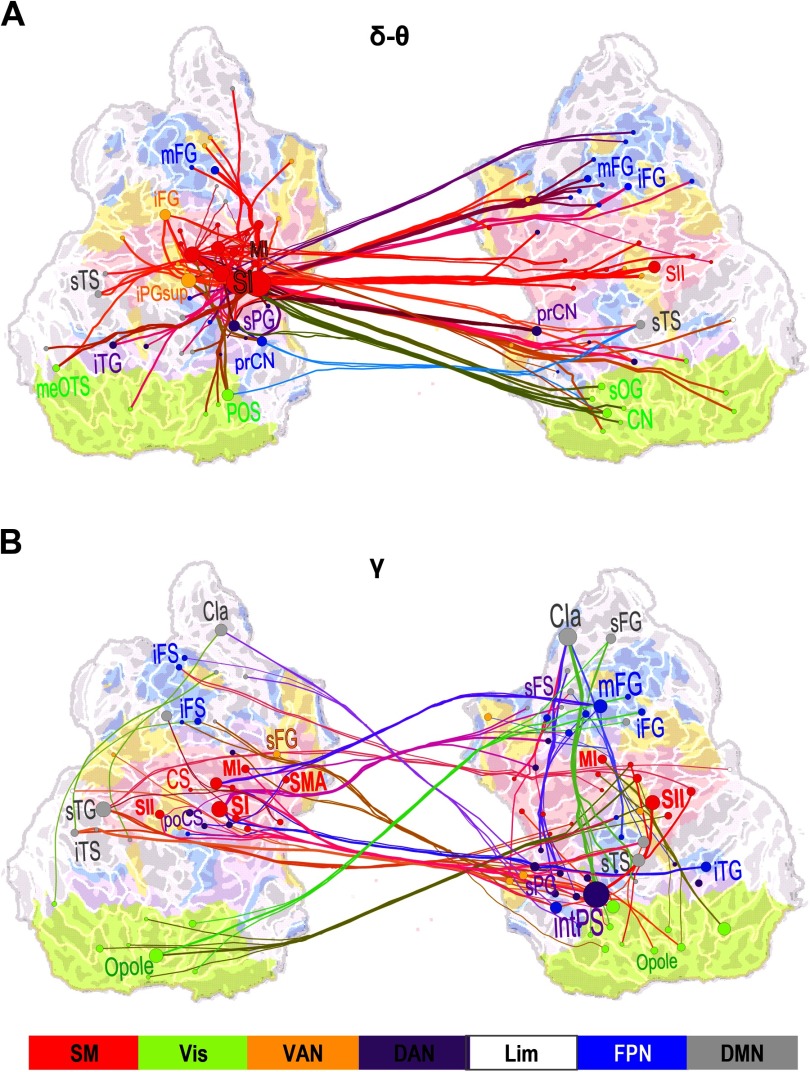
Figure 5. Large-scale synchronization connects somatosensory and attentional brain systems. (A) Graph of the significant differences in the strength of interareal phase synchrony as estimated with PLV between Hits and Misses in the delta/theta-frequency band (δ/θ, 3–7 Hz) and in the time window of 125–275 ms from stimulus onset (cf. Figure 2C). Lines connect the coupled parcels and line colors are determined by the parcel brain systems (see below). Delta/theta-band synchronization was centered on the contralateral (left hemispheric) sensorimotor (SM, red) system, and in particular, on the primary somatosensory cortex (SI) therein that was strongly and bilaterally coupled with frontal and parietal regions. (B) Graph of gamma-band synchronization (γ, 40–60 Hz) reveal significantly stronger connections for Hits than Misses over 225–375 ms from stimulus onset. Stronger gamma-band synchronization for Hits than Misses was observed within SM and between SM and the ipsilateral frontoparietal and dorsal (FP and DA, blue and purple) attention networks. Graphs are displayed on an inflated and flattened cortical surface with 300 (A) and 200 (B) of the most central edges based on parcel PageRank centralities selected for visualization. SI is primary and SII is secondary somatosensory area. MI and SMA are primary and supplementary motor areas, respectively. Parcel and corresponding node colors indicate the Yeo-atlas brain systems derived from BOLD intrinsic connectivity connectome. SM = somatomotor (SM), green = visual (Vis), yellow = ventral attention network (VAN), purple = dorsal attention network (DAN), white = limbic (Lim), gray = default mode network (DMN).

Figure 5.