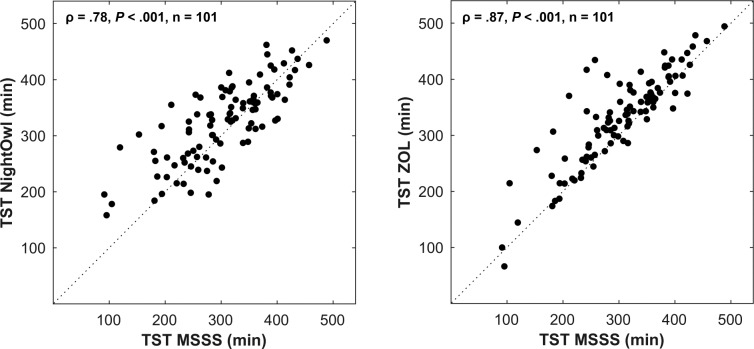
Figure 4. Scatter plots of comparison NightOwl-TST and ZOL-TST versus MSSS-TST.
The dotted line represents the points for which the y-axis values equal the x-axis values of the graph (identity line). ρ = Spearman correlation coefficient, MSSS = Michele Sleep Scoring System, P = P value, TST = total sleep time, ZOL = Ziekenhuis Oost-Limburg.

